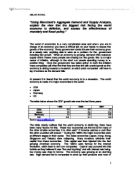
When the previous took place the US economy went backwards i.e. recession. Recession is defined as “periods of negative GDP growth” (source: Blanchard P24). During a recession the Government will be concerned about unemployment as this leads to an increase in benefits and also des not do any favours for re-election. Recession is when there is excess supply. At the initial price level, aggregate supply curve (AS) did not coincide with the demand curve (AD).
According to Blanchard AS is derived in the labour market and shows output on the price level. It is derived by wage setters and price setters respectively. The equation is: P = Pe (1 + µ) F (u, z) suggests that price is equal to expected prices which in turn depend upon the mark-up (1 + µ) a firms profit margin and variables, unemployment (u) and catchable variables (z) such at as government benefits. These conditions together form what is known as the AS relation. Aggregate demand on the other hand captures the effect of a price in relation to output. It is derived from the financial (LM) and goods (IS) markets. The diagram shows the intersection of the two shows equilibrium in the goods, financial and labour markets.
The AS curve has shifted to the right according to Blanchard because of expected prices. If consumers (wage setters) expect prices to decline in future they are willing to settle for a lower wage. This is similar to a recession, as prices fall. If interest rates fall this is likely to take place.
Making things worse in the world economy would be if demand suffered a decrease. An example currently is in the US, where by people are very cautious about the future. If demand drops for one company then it is likely other companies will suffer i.e. suppliers.
Looking at the AD more in depth we look at the IS/LM model. IS – goods market, it shows the levels at which goods market is in equilibrium. The IS curve is downward sloping because it shows output is a decreasing function of interest rate.
The equation: Y = C(Y-T) + I(Y, i) + G
The LM curve shows the financial markets in equilibrium, it is upward sloping as it depicts that the interest rate is an increasing function of income.
The equation: M/P = Y L(i)
The two form the aggregate demand, Y = Y (M/P), G, T
This suggests that output increases if real money, government expenditure increases and if taxes decrease i.e. increase peoples disposable income. If an economy is in recession the IS is likely to shift to the left, investments drop. Government expenditure will help to increase the confidence of the people and help o create jobs through building projects.
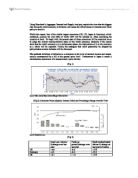
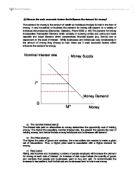
We can use the AS/AD analysis to show how excess supply leads to less demand.
An excess in supply results in the AS curve shifting to the right moving along the AD curve we arrive at point B. The shift in the AD curve to the left and back along the AS1, we now arrive at point C this is where the economy is now known as the short run. In the short run Y has declined assuming Y = N employment has also declined resulting in an increase in unemployment along with lower interest rates and lower price levels. According to Blanchard in the medium run output returns to its natural level through the aggregate supply. Blanchard suggests depending on whether natural output is above or below its natural level prices will either increase or decrease respectively.
To tackle the deflation problems faced by the world leaders, they have 2 tools at their disposal:
- Monetary policy
- Fiscal policy
Monetary policy is the control of money through generally interest rates. Extensive use of this policy is outlined by Alan Greenspan who is the chairman of the American Federal Reserve (FED), has cut interest rates from 6.75% to 1.75%, this is a massive drop. In doing so it is hoped that people have increased disposable income and hence stimulate the economy. At any price level the demand for money increases, the LM curve shifts down.
Therefore during recession the aim is to increase aggregate demand, a shift down in the LM curve results in an increase in aggregate demand.
The fiscal policy is related to the government spending and taxation. This is concerned with the IS curve. Government spending and reduction in taxes comes up both in the IS and the AD equation
Y = C(Y-T) + I (Y, I) + G
Y = Y (M/P) G, T
A reduction in the taxes results in increased spending power by the public, and business have increased profits. The inflation cycle kicks in and people spend and therefore economy grows.
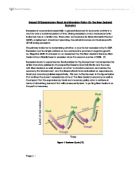
Diagram shows shift in IS to the right and movement along the LM curve show that output is increased whilst interest rates have also risen. Part b shows that the AD had shifted to the right resulting in higher output with a higher price level. In theory this is the effect both policies should have on an ailing economy.
The world economy needs to have these policies put into action to help kerb the negative growth. The current decline in the economy is closely related to the plight of the American economy. America was going down after the hi-tech bubble burst but furthermore to their problems was the terrorist attacks which threw the people back. This lowered confidence within the market and people withdrew money for safe keeping. At this point the government needs to reassure the public that their capital is safe. Increased government spending is one way.
The implication of monetary and fiscal policies thus far have not yet been very effective, it is worthwhile noting that the policies do take time o work through the economy i.e. government spending. To say that deflation is biggest risk of the world economy is a very debatable topic and economist will argue for years to come.
It is argued the economy will get worse before it gets better. The recession in the world economy is largely due to excess supply, with companies making false sales projections, expanding with new factories and then demand drops. Thus workforce has to be slimmed down and consumer confidence is lowered and thus recession. According to Blanchard we end up back at the natural level of output, questions arise how far away is the medium run? The government cannot wait for nature to take its course as such and therefore is doing all in its power to get the economy moving in the right direction again, given time it will grow, but how long?
Bibliography
Macroeconomics: Blanchard
Economics: Begg, Dornbusch, Fisher
Word count: 1560