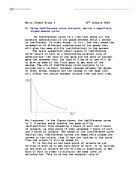
It is telling us how much hours of leisure we are willing to give up to get more hours of work. It is telling us how much of leisure we are willing to substitute to get more of work in order to maintain the same level of satisfaction. This is called the marginal rate of substitution (MRS). The marginal rate of substitution is the amount of one good (i.e. work) that has to be given up if the consumer is to obtain one extra unit of the other good (leisure).
The fact that the slope gets smaller (diminishes) as we move down the curve means that the consumer is willing to substitute less and less hours of leisure as more hours at work are spent. Thus the marginal rate of substitution is diminishing. The MRS is measured by the equation:
-∆X / +∆Y
The reason why the marginal rate of substitution diminishes is due to the principle of diminishing marginal utility. Where this principle states that the more units of a good are consumed, then additional units will provide less additional satisfaction than the previous units. Therefore, as a person consumes more of one good (i.e. work) then they will receive diminishing utility for that extra unit (satisfaction), hence, they will be willing to give up less of their leisure to obtain one more unit of work.
The relationship between marginal utility and the marginal rate of substitution is often summarised with the following equation:
MRS = MUx / MUy
While indifference curves describe the consumer’s tastes and, therefore, refer to what he or she would like to purchase, the budget line describes what the consumer can purchase.• Each consumer achieves an equilibrium that maximises his or her satisfaction at the point at which an indifference curve is tangent to the budget line.
The budget line is an important component when analysing consumer behavior. The budget line illustrates all the possible combinations of two goods that can be purchased at given prices and for a given consumer budget. Remember, that the amount of a good that a person can buy will depend upon their income and the price of the good.
- Explain & illustrate the income & substitution effects of a rise in the price of normal & inferior products.
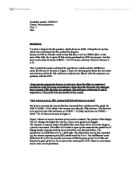
If we assume that a good is normal, then an increase in price will result in a fall in the quantity demanded. This is for two reasons; the income effect (have a limited budget, therefore can purchase lower quantities of the good) and the substitution effect (swap with alternative goods that are cheaper). These two processes can be visualised using indifference analysis.
Due to the price of good x increasing, the budget line has pivoted from B1 to B2 and the consumption point has moved.
The decrease in the quantity demanded can be divided into two effects;
The substitution effect is when the consumer switches consumption patterns due to the price change alone but remains on the same indifference curve. To identify the substitution effect a new budget line needs to be constructed. The budget line B1* is added, this budget line needs to be parallel with the budget line B2 and tangent to the first curve. Therefore, the movement from Q1 to Q2 is purely due to the substitution effect.
The income effect highlights how consumption will change due to the consumer having a change in purchasing power as a result of the price change. The higher price means the budget line is B2, hence the optimum consumption point is Q2. This point is on a lower indifference curve. Therefore, in the case of a normal good, the income and substitution effects work to reinforce each other.
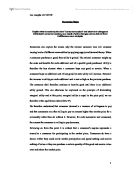
If on the other hand a good is inferior, as income rises, the demand for inferior products will decrease. If the price of an inferior good rises, the substitution effect will be in the same direction as for a normal good, i.e. negative. People will consume more of one product in terms of another, since one of the products is now more expensive relative to the other.
The rise in price of one commodity is signified by an inward pivot of the budget line from B1 to B2. As before, the substitution effect is illustrated by a movement along the original indifference curve. The quantity of X demanded falls from Q1 to Q2.
The income effect of the price rise, however, will be the opposite of that for a normal good; it will be positive. The reduction in real income form the rise in price of X well tend to increase the consumption of X, since with a fall in real income more inferior goods will now be purchased (including more of X). the income effect increases quantity back from Q2 to Q3.