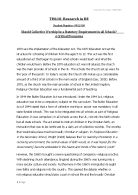
Figure 2 shows the GCSE results at School B from the years 2002 to 2005. It shows that the results have gradually decreased over the four years from 40% to 28%, 5 or more A* - C (DFES 2007b). It also shows that these results are below the average for both Coventry Local Education Authority and England as a whole.
During the weeks that I taught at School B I familiarised myself with their behaviour policy. Although I was not formally made aware of the policy, there was a copy pinned up on a notice board in the staff room. Similarly to School A, the policy outlined its aims and principles, and sanctions that were appropriate for different offences. It also emphasised uniform and the need for all pupils to wear full, correct uniform. Within their behaviour policy is the option of sending pupils to ‘isolation’, which was a room with single desks where pupils would have to spend the day, isolated. Within the PE department, the pupils were expected to where correct PE kit and relevant sanctions were to be enforced if pupils had no or incorrect PE kit.
Having introduced the two schools being addressed, I will now discuss personal reflections from my experience in the schools relating to the behavioural polices and their implementations.
My Reflections
My teaching experience in School A and B have both been rewarding, although very contrasting in terms of behaviour policies and its management. I am aware that, due to my current and predominant status as an employee of school A, I may have an element of bias within my reflection. However, I will try to present my reflections in an impartial manner that does not let this come to the fore.
My overall conclusion of the two schools is that School A is more effective in its overall implementation of behaviour management. This conclusion has been reached as a result of a number of factors within my experiences. Looking at whole school issues, I felt that School B did not have the same high expectations and consistency as School A. For example, both behaviour policies state the importance of uniform, yet it was common to see pupils at School B wearing trainers, or shirts hanging out which is not part of its uniform code. In contrast, at School A the stance on uniform is much more stringent with detentions regularly given out for relatively minor uniform offences, in complying with the uniform code.
Within the PE department there was also a similar situation in terms of uniform. At School A, an automatic detention is given if pupils do not bring full PE kit, which results in a low number of pupils not taking part in PE lessons. In comparison, School B is more relaxed with PE kit. Pupils were verbally reprimanded if they had no PE kit but from my experience, this was never followed up with a further punishment. Consequently pupil numbers of non-participants in PE lessons was a lot higher than that of School A.
Within the classroom I felt that expectations were also low at School B not necessarily academically but in terms of behaviour. For example, within all the lessons that I was involved in at School B, foul and abusive language was a common and reoccurring element within the classroom environment amongst pupils. On the odd occasion a pupil was verbally warned by a teacher relating to bad language but no further sanctions were employed. I found this very challenging and felt that the behaviour management policy at the school was not being withheld. In comparison, at School A, although pupils use bad language occasionally in lessons the frequency of its use is minimal when related to School B. If a pupil uses bad language frequently then they would be sent to H9 where they would go to a room with a member of staff for the remainder of the lesson. This would also amount to a Head’s Detention where they would have to stay for an hour with the head one night after school. This system is used consistently across the school, whereas at School B, I wasn’t aware of one occasion that a pupil was sent to their equivalent (isolation) for the use of foul and abusive language.
One final observation to be made from my experiences also relates to classroom management and is the use of personal equipment during lessons (mobile phones MP3 players). Both school behaviour policies clearly state that mobile phones or other personal technologies are not permitted in school and will be banned if found on a pupil. At School A, it is known that, especially in the upper years, pupils have phones on their person. However, every member of the school is clear f the policy on phones and if a phone is found on a pupil then it is confiscated and sent to reception, where the pupil’s parnts/carers can collect it. However, at School B I was shocked at the relaxed manner taken in relation to these items and it was common practice for pupils to be playing with their phones, even having phone conversations during lessons. Pupils also commonly were listening to music on headphones in both practical and theory PE lessons and during my experience at the school, not one item of personal equipment was confiscated and not one pupil was reprimanded.
My feeling when teaching at School B was that teachers felt that they could not enforce these rules, as there was no consistency throughout the school and a lack of support from senior management relating to these issues. However, I was also aware that some teachers were in a comfort zone and therefore were quite happy with the above issues and felt that to start punishing pupils for the above offences would not be beneficial to the pupils (My daily reflection for the work I did at School B can be seen in APPENDIX 1 where some of the above issues and further issues are raised in more detail). In comparison, at School A there is consistency and I have been made known on a number occasions that the senior management would support me 100% in relation to the above behavioural issues and I have no doubt that they would, which gives me confidence in my behaviour management.
Having discussed my feelings about the two schools in relation to their behaviour policies and their implementation, I will now evaluate the two experiences focusing on literature in the area and the faith / non-faith status of the schools.
Evaluation
I am aware that in my reflections I made some strong statements about the two Schools in question and that again, my predominant experience at School A may have lead to an element of bias within my reflection. However, I will now justify my thoughts through analysing why, from my experience, there is such a behavioural discrepancy between the two schools.
The faith status of School A allows it to be selective in its admissions policy, therefore giving it the potential to select pupils from affluent socio-economic backgrounds. In contrast School B, a non-faith school, has an intake of pupils that are predominantly from deprived socio-economic backgrounds. This is a factor that must be taken into consideration when analysing the behaviour at the two schools and the question could be asked: are the behavioural discrepancies between the schools as a result of their pupil intake? I am sure that this is no doubt a factor, however School A does enrol its pupils from a wide range of backgrounds. It has also; more recently changed its admissions policy to allow more children from the surrounding area, a deprived socio-economic area, to enrol at the school (OFSTED 2001).
A useful comparative tool here is Contextual Value Added (CVA) scores, allowing these considerations to be taken into account. School A has the highest Key Stage 2-4 CVA score in its local authority of 1014.1 in comparison to School B who are at the bottom end of the table for its local authority with a score of 945.1 (BBC 2007). Although this doesn’t have a direct link to behaviour within the schools, it does illustrate that, during their time at the school, pupils experience more academic improvements in School A than in School B. Behaviour management within the schools however, could be argued to indirectly have a strong influence on the CVA scores.
At the beginning of the assignment, behaviour policy was defined (Clarke 1996 in Turner 2003) and placed an emphasis on all members being consistent with the values of the school. Turner (2003) reinforced this in her study, where she examined the behaviour policy of a particular school. Turner (2003) highlighted that, in the school she examined, inconsistency occurred in behaviour management when new staff were inducted and not given sufficient guidance on the procedures laid out in the behaviour policy. Within the induction process that I undertook at School A, I was clearly taken through the behaviour policy at an induction meeting. However at School B, although I was only at the school for a short period of time, I was not given any guidance on the school’s behaviour policy. I cannot assume that new, permanent staff at School B are not given a sufficient induction, but this could be a pertinent factor in the effectiveness of the policy implementations at the two schools. At this point it is important to note, however, that this issue has no reflection on the faith / non-faith status of the schools.
A strong theme that arose from my reflections of my experiences in the schools was that of the expectations that staff had of pupils. From my knowledge of both school’s behaviour policies, they are both comprehensive and theoretically sound. Therefore the discrepancies that occur between the effectiveness of the policies at the schools must be as a result of their implementation. Falvey (1995) suggests that the expectations of others can influence the behaviour of pupils. Falvey (1995) continues that, if a pupil has been labelled as difficult then teachers will typically expect that child to be challenging. Subsequently, as this is the expectation, the pupil is likely to live up to it (Falvey 1995). From my experience at School B, I feel that this is occurring, with low expectations from the teachers resulting in a poor level of behaviour by pupils. In contrast, School A has a consistency of high expectations throughout the school, which is confirmed by and reflected in its CVA score.
This is furthered by research by Martin and Hayes (1998) who concluded that ‘unacceptable behaviour’ is very subjective and is dependant on individual perception of what is considered as ‘normal behaviour’. This research almost mirrors my experiences at both School A and B. At School A, it was unacceptable behaviour for pupils to be in possession of a mobile phone and consequently, sanctions would be enforced. However at School B, it was considered as normal behaviour for pupils to have mobile phones in their possession so teachers allowed it to occur. This incongruence between behaviour policy and its implementation coupled with low expectations at School B, I feel are key factors as to why, in my opinion the school is less effective in delivering it’s behaviour policy.
Bauckham (1996) writes that, in faith schools, a…..
shared identity through faith plays a roll in nurturing the moral and personal growth of children.
This linked again to the definition of behaviour policy by Clarke (1996 in Turner 2003) who emphasised ‘all members’ being consistent with the schools policy, suggests the potential strength of behaviour policies in faith schools. Thus, all members share the identity and ethos of the school and therefore would all be united in its behaviour policy. Bauckham (1996) also argues that within faith schools, public worship and celebrations of religious festivals are present more strongly than in non-faith schools, which must be influential in creating a climate that is conducive to learning. Relating this to my experience, the pastoral system at School A incorporates morning and afternoon registration periods. These include religious assemblies and celebrations of Christian festivals, which could be a factor in establishing the pupil’s sense of identity at the school and therefore the respect of the teachers and the rules that they impose. In comparison School B have one registration period at lunchtime, which may not allow pupils and teachers to gain such a shared sense of identity as is experienced in School A.
Conclusion
Having examined behaviour polices and their implementation at two very different schools, it has become clear that behaviour and its management within schools is a multidimensional concept that is dependant on a multitude of factors. This assignment has highlighted a few of these factors including school intake, consistency of policy delivery, a sense of identity of all members of the school and incorporated in all of the above aspects, the faith / non status of the school.
To address the proposed question (are faith schools more effective in their implementation of behaviour policies?), the assignment has provided evidence to suggest that they are. The core reasons in this incidence have been attributed to the sense of identity, shared community and therefore unity in the values of the behaviour policy. However, the findings from this assignment are very limited as the two schools examined differ greatly, regardless of their status as a faith / non-faith school. Nevertheless, it has highlighted contributing factors to the success of behaviour policies that are related to the nature of faith schools. It can therefore be argued that faith schools provide the environment from which behaviour policies can be best implemented. This is as a result of the unity that is shared by members within the school not just of the behaviour policy or the strive for academic success, but the belief in something much greater than that of the individual school; God.
References
Bauckham, I. (1996) Providing choice in good faith [online]. Teaching expertise. Available from: . [Accessed 2 April 2007]
BBC (2007) Schools in Coventry [online]. BBC Education. Available from: [Accessed 4 April 2007]
Clarke, D. (1996) ‘What a Behaviour Policy Should Contain’, in Turner, C. (2003) ‘How effective and inclusive is the school’s behaviour policy?’. Emotional and Behavioural Difficulties 8 7-18
DFES (2007a) School A League Tables [online]. DFES League Tables. Available from: [Accessed 4 April 2007]
DFES (2007b) School B League Tables [online]. DFES League Tables. Available from: [Accessed 4 April 2007]
Falvey, M.A. (1995) Inclusive and Heterogeneous Schooling: Assessment, Curriculum and Instruction. Baltimore, MD: Brookes.
Martin, H. & Hayes, S. (1998) ‘Overcoming Obstacles: Approaches to Dealing with
Problem Pupils’, British Journal of Special Education 25(3): 135–9.
OFSTED (2001) ‘Inspection Report: School A’. Ofsted
OFSTED (2005) ‘Inspection Report: School B’. Ofsted
School A (2007a) ‘Prospectus’ [Online]. School A. Available from: School A website [Accessed 2 April 2007]
School A (2007b) ‘Behaviour Policy’ [Online]. School A. Available from: School A website [Accessed 2 April 2007]
Turner, C. (2003) ‘How effective and inclusive is the school’s behaviour policy?’. Emotional and Behavioural Difficulties 8 7-18