EPANET is a computer program that performs extended period simulation of hydraulic and water quality behaviour within pressurized pipe networks
School of Computing, Science & Engineering
Civil Engineering
EPANET
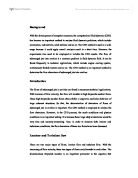
EPANET is a computer program that performs extended period simulation of hydraulic and water quality behaviour within pressurized pipe networks. A network consists of pipes, nodes (pipe junctions), pumps, valves and storage tanks or reservoirs. EPANET tracks the flow of water in each pipe, the pressure at each node, the height of water in each tank, and the concentration of a chemical species throughout the network during a simulation period comprised of multiple time steps. In addition to chemical species, water age and source tracing can also be simulated. EPANET is designed to be a research tool for improving our understanding of the movement and fate of drinking water constituents within distribution systems. It can be used for many different kinds of applications in distribution systems analysis. Sampling program design, hydraulic model calibration, chlorine residual analysis, and consumer exposure assessment are some examples. EPANET can help assess alternative management strategies for improving water quality throughout a system.
These can include:
· altering source utilization within multiple source systems,
· Altering pumping and tank filling/emptying schedules,
· Use of satellite treatment, such as re-chlorination at storage tanks,
· Targeted pipe cleaning and replacement.
Running under Windows, EPANET provides an integrated environment for editing network input data, running hydraulic and water quality simulations, and viewing the results in a variety of formats. These include colour-coded network maps, data tables, time series graphs, and contour plots.
Procedure of drawing
Our first task is to create a new project in EPANET and make sure that certain default options are selected. After launching EPANET, we select File >> New (from the menu bar) to create a new project. Then select Project >> Defaults to open the dialog form shown below. This dialog automatically labels new objects with consecutive numbers starting from 1 as they are added to the network. On the ID Labels page of the dialog, we clear all of the ID Prefix fields and set the ID Increment to 1. Then we select the Hydraulics page of the dialog and set the choice of Flow Units to GPM (gallons per minute). This implies that US Customary units will be used for all other quantities as well (length in feet, pipe diameter in inches, pressure in psi, etc.). Also select HazenWilliams (H-W) as the head-loss formula. If you wanted to save these choices for all future new projects you could check the Save box at the bottom of the form before accepting it by clicking the OK button.