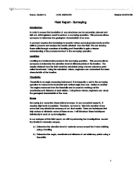
Calculation - Two Peg Test
- Calculate the difference between fore-sight and back-sight for the two sets of results recorded
-
Using the two calculated values, find their difference
Equation: (FSM-BSM)-(FSO-BSO)
(If the difference between the two values is less than 0.1, the levelling instrument is fairly accurate. Conversely, if the difference between the two values is higher more than 0.1, the levelling instrument would need adjustment.)
Table 1 - Results for Determining the Collimation Error of the Levelling Instrument
Table 1 shows the Collimation Error results from the Two Peg Test. The final calculated figure from the results shows the difference between Mid Point and One Third Point was 0.002, which means that the levelling instrument is fairly accurate and needs no adjustment.
Procedure - Determine the Elevation Level of manhole covers around the Horton Building
- Set up the levelling instrument at an arbitrary station
- Take a back-sight reading on the staff from the temporary bench mark (TBM)
- Move the staff and place it on a manhole cover, take this as an intermediate-sight reading
- Repeat step three with manholes in the sight of your station
- Set a flyer marker and take this as your fore-sight reading
- Mover the levelling instrument to a second arbitrary station and take the flier marker as your back-sight reading
- Repeat step three to six until your back at the TBM
- Record the final readings of the TBM, take this as your fore-sight reading
Results for Investigation 1
Table 2 - Results for Determining the Elevation Level of Manhole Covers around the Horton Building
Table 2 show the levelling results of individual manhole covers around the Horton Building. The height of collimation and reduced level are calculated on the table using the results. The calculations would be explained in more detail below.
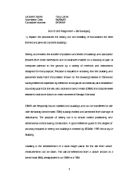
Calculations – Determine the Elevation Level of Manhole Covers around the Horton Building
Using the results obtained from the levelling exercise, we can process our data by finding the height of collimation of each point using our known reference point, TBM.
- The TBM was given as 20m, this figure is our first reduce level (RL)
- Using the RL value, add the BS value which equals to the first HC value (RL+BS = HC)
-
Using the first calculated HC value, subtract all the IS value from it. This equals to the HC values of the manhole covers (HC-IS = HCm)
-
Using the first calculated HC value, subtract the FS value from it. This equals to the new RL value from a new station (HC-FS = RLs)
- Repeat steps two to four until all the HC and RL values of points are calculated
Accuracy of the Calculation
To ensure our calculations were correctly done, we applied an accuracy check by calculating the difference between the sum of BS and FS and compare the difference found between the first and final reduced level figures.
If the difference between the sum of BS and FS compare to the difference between the first and final reduced level is the same, then the calculations are precisely accurate. On the other hand, if the two values are not the same, then the calculations would need to be revisited.
- Sum of BS = 6.562 Sum of FS = 6.600
Difference between the sum of BS and FS: 6.600-6.562 = 0.038
- Difference between the first and final calculated RL values: 20.000-19.962 = 0.038
As you see from the calculation above, the difference between the two calculated values is the same, which means the calculations are accurate.
Diagram 1 - Determine the Elevation Level of Manhole Covers around the Horton Building
The diagram on page five shows the position and elevation level of all the individual manhole covers located around the Horton building. The variation in level values of the manhole covers suggests that the ground is not completely horizontal. The highest and the lowest height of collimation values of the manhole covers were approximately 0.325m in difference. This may have built purposefully to ensure that the rain flows easily into the drainage system and reduces the level of flooding.
Conclusion - Determine the Elevation Level of Manhole Covers around the Horton Building
The levelling method has allowed us to determine the elevation level of manhole covers around the Horton building.
The levelling exercise was performed once and the results were recorded on Table 2. We then calculated the height of collimation and reduced level using the results and we ensured the calculation were accurate by applying further mathematical calculations. The process had proven the calculated values were correct and we plotted a diagram to show the elevation level and position of the manholes on Diagram 1.
To ensure that our levelling instrument was levelled, we performed a “Two Peg Test” to ensure that the instrument was at a horizontal level in attempt to reduce any collimation error that may occur during our investigation. If we look at the results and calculation recorded on Table 1, the difference calculated for Mid Point and One Third Point figures was approximately 0.002m. This would have been a human induced error, which was possible that we may have read the figures incorrectly on the staff. It is possible to improve the readings accuracy by using a more precise levelling instrument and a higher increment of levelling staff, but these equipments would cost considerably more. Other inexpensive solutions such as repeating the experiment would also improve the accuracy of our results. However, we did not have time to repeat our experiment and therefore this method also did not apply.
Investigation 2 - Determine the Angle, Coordinate and Distance of Set Stationary Points Using a Theodolite
In this investigation, we will be using a theodolite to measure the horizontal angles of set stationary points. We will also require a tape measure and a compass to determine the slope distance and the whole circle bearings (WCB) from each station. This process is known as traversing. The results obtained from the field exercise are then used in calculation to find the coordinates of each stationary point.
The theodolite uses a scientific measuring device to calculate the horizontal and vertical angles of a station targeted. We will be recording the horizontal readings of each station using the face-left and face-right of the theodolite. This process helps us to reduce the error in our readings by calculating the mean values using face-left and face-right. I will explain this technique in more detail later in this report.
Equipment - Determine the Angle, Coordinate and Distance of Set Stationary Points Using a Theodolite
For the theodolite exercise, we would require the following equipments
- Theodolite – measure the angles between the stations
- Tripod – balance the Theodolite with an adjustable height
- Tape Measure – measure the slope distances between each station
- Compass – measure the bearing from station A to station B
Procedure - Determine the Angle, Coordinate and Distance of Set Stationary Points Using a Theodolite
- Level the theodolite over station A and target station C
- Take the horizontal readings of station C using face left of the theodolite
- Then, target station B and take the horizontal readings using face left of the theodolite
- Repeat steps two and three using face right of the theodolite
- Apply the same procedure on station B and C using steps one to four
- Measure the lengths of station A, B and C using a measuring tape
- Record the measured lengths
- Measure the whole circle bearing from A to B using a surveyor’s compass
- Record the angle reading
- Repeat step eight and nine twice to obtain three sets of readings
Results for Investigation 2
Table 3 - Determine the Angle, Coordinate and Distance of Set Stationary Points Using a Theodolite
Table 3 shows the angles recorded from each stationary point. The angle of each station targeted is recorded twice using face-left and face-right of the theodolite. The mean and reduced level values are calculated on the displayed column. The calculations are explained below.
Calculations - Determine the Angle, Coordinate and Distance of Set Stationary Points Using a Theodolite
- Calculation for the Mean Angle Value
As mentioned in our introduction, by recording the horizontal readings of each station using the FL and FR of the theodolite, we can reduce the reading error by finding the mean value from the results of FL and FR. However, the FL and FR figures are completely different to each other because they were measured using opposite facing of the theodolite. In order to adjust this issue, we have to keep the FL results and convert our FR value to FL by adding or subtracting one-hundred and eighty degrees from its original number.
For example, using the results from station A, target B, the FL value is 304°22'00.00” and the FR value is 124°22'10.00". In proportion, the FR value is much smaller than the FL value, therefore we add 180°00'00.00" to the FR value. We then add it to our FL value and divide our new figures by two to get the mean value.
- Calculation for the Reduced Direction Value
The calculation for the reduced direction is done by subtracting all the mean values from the angle of the first targeted station.
For example, using the results from station A, we subtracted the mean values from the angle of the first targeted station:
Mean from target C: 00°16'50.00"- 00°16'50.00" = Reduced Directions 00°00'00.00"
Mean from target B: 304°22'05.00"-00°16'50.00" = Reduced Directions 304°05'55.00"
Mean from target C: 00°16'50.00"- 00°16'50.00" = Reduced Directions 00°00'00.00"
However, the angle of the reduced direction does not always provide us with an internal angle. As we can see from the calculation above for target B, it has a reduced direction of 304°05'55.00", which is the external angle of BAC. We can resolve this issue and convert this value to an internal angle by subtracting the external angle of BAC from 360°00'00.00", which gives us the answer of 55°94'45.00".
The reduced direction angles help determine the triangular angles of each station. This also verifies the accuracy of our triangular set stations by using trigonometry. The sum of angles of a triangle is one-hundred and eighty degrees. As the stationary points are placed on each corner of the triangle location, the sum of angle of stationary point A, B and C should also add up to one-hundred and eighty degrees using the reduced direction angles.
Station A = 55°94'45.00" 55°94'45.00"
Station B = 47°69'80.00" 47°69'80.00"
Station C = 76°37'50.00" + 76°37'50.00"
Sum of angles A, B and C = 180°01'75.00"
As you can see from the calculation above, the sum of the three angles did not add up to 180°00'00.00". The error difference was 00°01'75.00". This may have been caused due to human error, such as observation and levelling errors.
- Calculation for Horizontal Distance
Table 4 - Calculation for Horizontal Distance
Table 4 shows the results of the slope distance measured using a tape measure. The elevation levels of each stationary point were provided by the lecturer and the horizontal distances were calculated using the following equation.
Horizontal Distance = √ (Slope Distance2-Difference in Height of stations2)
For example, from station A to B, the difference in height of stations is the elevation level of B minus A. The answer equalled to 2.34 m. We then use the formula above to find our horizontal distance, √ (27.932-2.342) = 27.83180375m.
- Calculation for Coordinates
Using the results obtained from the theodolite exercise, we can process our data by finding the coordinates of the three control stations.
- Assume station A has coordinates (100E, 500N)
- Using the Whole Circle Bearing (WCB) from A to B, 229°50'00.00" and horizontal distance of AB, 27.83180375 m, calculate the coordinates of station B using the REC function
REC (27.83180375, 229°50'00.00") x = -17.95188136, y = -21.26826875
- Using station A coordinates, take away value x from 100E and value y from 500N
B (100+(-17.95188136) E, 500+(-21.26826875) N)
= B (82.04811864 E, 478.7317313 N)
- Repeat this with station C and change the WCB by adding 180°00'00.00" to WCB AB and subtract the angle of station B
WCB = 229°50'00.00"+180°00'00.00"-47°69'80.00" = 361°39'40.00"
Horizontal Distance of BC = 23.64520882
REC (23.64520882, 361°39'40.00") x = 23.63527229, y = 0.6854225107
C (82.04811864+23.63527229 E, 478.7317313+0.6854225107 N)
= C (105.6833909 E, 479.4171538 N)
- Repeat step iv with station A and check if the answer returns to the original coordinates of station A
WCB = 361°39'40.00"+180°00'00.00"-76°37'50.00" = 465°01'50.00”
Horizontal Distance of AC = 21.12676028
REC (21.12676028, 465°01'50.00”) x = -5.478890034, y = 20.40396442
A (105.6833909 +(-5.478890034) E, 479.4171538 +20.40396442 N)
= A (100.2045009 E, 499.8211182 N)
The final coordinates of station A, did not match our original coordinates. This was due to the small angle errors we found on the earlier stages of the report. Their deviation from the original coordinates is approximately +/- 0.2. However, this small margin of error is considered expectable in civil engineering, but in order to improve the accuracy of our results, we may require a GPS system or equipments that measures at a greater accuracy.
Diagram 2 - Determine the Angle, Coordinate and Distance of Set Stationary Points Using a Theodolite
The diagram above concludes our final results for the angle, the horizontal distance and the coordinates of our stationary points.
Conclusion for Investigation 2
In this investigation, we used a theodolite to determine the angle of set stationary points. We then measured the slope distance and the Whole Circle Bearing from one station using a tape measure and a compass. These results were recorded on Table 3 and Table 4. We calculated the coordinates of the stationary points using our results shown in the report.
To ensure the accuracy of our results, we imposed a few mathematical methods. One of the methods was summing the angles of our triangular stationary points to verify our angles should add up to one-hundred degrees. This result was bigger than our expected angle, however, because of its small difference of 00°01'75.00" the results were consider to be valid.
Looking at our calculations for the coordinates of stationary points, we were able to calculate an approximation values for each station. Unfortunately, the small angle error in our results had also contributed a small percentage error to our final results. Due to this, we can only conclude that our stations’ coordinates were an approximation of the actual figures.