Prior Probabilities for Groups
Assumption of homogeneity of variance
If we fail to reject the null hypothesis and conclude that the variances are equal, we use the SPSS default of using a pooled covariance matrix in classification. And in this case the significance of .149 > .05 so we fail to reject and the homogeneity is satisfied in this case.
Test Results
Overall Relationship
The Wilks' lambda statistic for the test of the function (Wilks' lambda=.496) had a probability of p=0.003 which was less than or equal to the level of significance of 0.05. Which indicates that there is an overall relationship.
Wilks' Lambda
Multicollinearity
Like multiple regression, multicollinearity in discriminant analysis is identified by examining tolerance values. While tolerance is routinely included in the output for the stepwise method for including variables, it is not included for simultaneous entry of variables. If a tolerance problem occurs in a simultaneous entry problem, SPSS will include a table titled "Variables Failing Tolerance Test." So since SPSS did not include this table it indicates that multicollinearity is not a problem in the analysis. No problem with multicollinearity exists in this year’s data or any other years so it will not be included in the analysis from here on out.
Role of independent variables in predicting group membership
Functions at Group Centroids
Unstandardized canonical discriminant functions evaluated at group means
In this analysis this discriminant function assigns positive and negative values to separate the subgroups, making the playoffs and not making the playoffs. This is used to differentiate between the two groups.
Structure Matrix
Looking at the structure matrix all of the independent variables correlate with making the playoffs since they have negative values. As you can see On-Base % (-.729) is the most important variable contributing to making the playoffs. Followed by Runs Scored (-.597). The Average Batters age actually correlates with making the playoffs but since the discriminant function thinks a higher avg is better it says that it will have the opposite effect, but in reality the teams that made the playoffs have batters with a lower average age which indicates younger players result in a better chance of a team making the playoffs but it is not as strong a factor as 3 of the independent variables(.153). And finally when looking at the effect each independent variable has on the overall function homeruns was the least important in determining whether or not a team makes the playoffs (-.132).
Classification using the discriminant model
After looking at the classification results the model correctly classified 93.3% of the original group cases. In this analysis only ARZ and CHC were classified as not making the playoffs when they actually made the playoffs. Since it is not possible to have the model predict 8 teams to make the playoffs, 4 rom each division, it only predicted 6 teams to make the playoffs when 8 teams are required for the playoffs. Even with the error in the model it still provides significant results in predicting a teams participation in the playoffs. On-Base %, Runs Scored, Batting Average, Average Batters Age, and Homeruns all are important offense statistics to determine whether or not a team will make the playoffs. While some are more important than others they all provide information to help predict the results.
Defense
Assumption of homogeneity of variance
The assumption of homogeneity of variance is satisfied in this analysis. Since the significant value .988 > .05 we fail to reject the null hypothesis that tests the null hypotheses that the group variance-covariance matrices are equal. Since we fail to reject we will use the group variance-covariance matrices and can conclude that homogeneity is satisfied.
Overall Relationship
While if you used the normal way to determine the significance of the overall model .135 > .05 we would say there is no overall relationship. But when looking at the independent variables separately the results are significant.
Role of independent variables in predicting group membership
In the discriminant function it seperates between the two supgroups, making the playoffs and not making the playoffs, here the variables with negative values will relate to teams who did not make the playoffs and positive values will correlate with teams who did make the playoffs.
When reviewing the structure matrix 2 variables load on the not making the playoffs, Runs Allowed(-.674) and Hits Allowed(-.511), and 3 variables relate to making the playoffs Team Fielding %(.691), Saves(.514), and Average Pitchers Age(.444). So teams that allowed more runs and hits were predicted to not make the playoffs. And teams that had a higher fielding percentage, more saves and a higher pitcher’s average age have a better chance of making the playoffs.
Classification using the discriminant model
The overall model correctly classified 83.3% of the original cases. This is pretty significant and even though it showed that there wasn’t an overall relationship when looking at variables independently and the overall classification rate it is clear a relationship exists. This time like the offense analysis for 2007 they said ARZ and CHC should not have made the playoffs, also they conclude based on the defense statistics that LAA and NYY should not have made the playoffs. And they predicted SD make the playoffs when they did not make the playoffs. This result gave me more hope in the actual model because in 2007 SD had to play COL in a extra game to see which would advance to the playoffs so it would make sense they model predicted them to make it.
2006
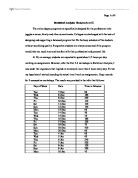
Descriptive Statistics
Here you can see there is not a problem with skewness, and there exists a slight problem in kurtosis for Average Batters Age and Runs Allowed. So we will proceed with caution in the analysis when looking at these to variables.
Offense
Assumption of homogeneity of variance
The assumption of homogeneity of variance is satisfied in this analysis. Since the significant value .849 > .05 we fail to reject the null hypothesis that tests the null hypotheses that the group variance-covariance matrices are equal. Since we fail to reject we will use the group variance-covariance matrices and can conclude that homogeneity is satisfied.
Overall Relationship
The Wilks' lambda statistic for the test of the function (Wilks' lambda=.833) had a probability of p=0.459 which was greater than or equal to the level of significance of 0.05. Which indicates that there is not an overall relationship.
Wilks' Lambda
Role of independent variables in predicting group membership
Functions at Group Centroids
Unstandardized canonical discriminant functions evaluated at group means
In the discriminant function it seperates between the two supgroups, making the playoffs and not making the playoffs, here the variables with negative values will relate to teams who did not make the playoffs and positive values will correlate with teams who did make the playoffs.
Structure Matrix
In the discriminant model 4 of the 5 statistics relate to teams making the playoffs. The independent variable that most significantly influences whether a team makes the playoffs or not is On-Base % (.671), followed by Average Batters Age (.640), Runs Scored(.611), and lastly Batting Average(.466). And for 2006 Homeruns correlates with teams not making the playoffs and that is why it has a negative value (-.048) but since it is less than .30 it really doesn’t have much of an effect on the model.
Classification using the discriminant model
Though the model successfully predicted 76.7% of the original groups, it only correctly classified 25% of the teams that made playoffs. In this case they only predicted 3 teams to make the playoffs which doesn’t really cooperate with the MLB, because 8 teams make the playoffs, but there is no way to account for this error. So since there is no overall relationship this analysis isn’t really useful. But when looking at previous and following year models it is important to still consider these results in trying to determine if this model can be used to predict whether or not a team makes the playoffs. So in this case they only predicted LAD, NYY, and SF to make the playoff, of which only MIL and NYY actually made the playoffs. And they predicted NYM, STL, SD, DET,MIN and OAK. This is interesting because the World Series in 2006 was between STL and DET which would mean both teams should not have made the playoffs based on these statistics. It is also important to mention that many other variables that can predict a team making the playoffs that is far beyond the scope of this model.
Defense
Assumption of homogeneity of variance
Test Results
Tests null hypothesis of equal population covariance matrices.
The assumption of homogeneity of variance is satisfied in this analysis. Since the significant value .202 > .05 we fail to reject the null hypothesis that tests the null hypotheses that the group variance-covariance matrices are equal. Since we fail to reject we will use the group variance-covariance matrices and can conclude that homogeneity is satisfied.
Overall Relationship
The Wilks' lambda statistic for the test of the function (Wilks' lambda=.548) had a probability of p=0.009 which was not less than or equal to the level of significance of 0.05 but close enough for this anlysis. Which indicates that there is an overall relationship.
Role of independent variables in predicting group membership
In the discriminant function it seperates between the two supgroups, making the playoffs and not making the playoffs, here the variables with negative values will relate to teams who made the playoffs and positive values will correlate with teams who did not make the playoffs.
In the discriminant model 3 of the 5 statistics relate to teams making the playoffs. The independent variable that most significantly influences whether a team makes the playoffs or not is Saves (-.474), followed by Average Pitchers Age (-.400), and lastly Total Team Fielding %(-.227) And for 2006 Run Allowed(.870) and Hits Allowed (.440) correlates with teams not making the playoffs.
Classification using the discriminant model
The discriminant model was able to correctly classify 90% of the original group cases which makes the model extremely significant. In this model they did not predict STL and OAK to make the playoffs when they actually made the playoffs and predicted HOU to make the playoffs when they didn’t actually make the playoffs. So you could say based on this model, the independent variables used can be used to predict whether or not a team will make the playoffs.