Population Parameters
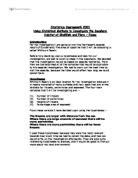
The parameters that we had, when we were making the questionnaire, were what kind of people that we are going to ask them. When we had to work out the limits we had was that the amount that we needed to know was the minimum and maximum total of people that we were going to ask for the questionnaire to be filled out sufficiently. We thought that a minimum of 36 an maximum of 44 so we thought that the best idea was to split the amount of the two and went with 40 as it was the median of the two numbers.
In the following table shows the questions which was asked that the results found was that we found that the percentages was as follows:
1)
2)
3)
4)
5)
6)
7)
8)
9)
10)
11)
12)
13)
Looking at the percentage results it shows than the most common answers would have been from a male that is between 18-25 and employed. They are single that is likely to vote and is somewhat interested in the election. They will be voting for the Labour party and thinks that the current party has not done good but also has not done bad on its election promises, has done good towards delivering the education side of their promises and not good but not bad on the National Health Service. Education is the main priority and the population has decided to go with the labour because of its best policies.
Predictions for the Next General Election
Based on the information we collected from the questionnaires, we conclude that the population would prefer for Labour to win the next election, with the Conservatives in a very close second, and Liberal Democrats in third place.
The table below shows the tallied results of our questionnaire, which backs up our prediction:
The graph below also shows the results:
The question ‘Which party do you think will win the Next General Election in this constituency?’ was also asked in the questionnaire. The results are shown below:
These results also back up our conclusion that the population would prefer the Labour party to win the election, as 30% of the population think that Tony Blair will win, even if they don’t want him to.
The results shown are just for this constituency, so based on our conclusions it is of our opinion that this trend of the Labour party being ahead in the polls will reflect the national outcome of the next General Election.
Limitations of the Survey
Location
In our group we surveyed about 40 people throughout the Taunton area; we would have had more choice of comparison if we chose some different towns rather than just Taunton on its own. If we had collected information and analysed different towns points of views we might have received different opinions, e.g. if they had better services than us or if they have more pollution it might make the voter think more about those areas and party policies towards those areas.
Population
There are a lot of the population that don’t vote, never have voted or don’t know anything about the elections or the parties. We are expecting from the target population an answer to which party they may vote for, the information we received we expect to be right. We are limited to the correctness of the data we collect, as some people may not put correct information down on the survey, as they may not know anything about the parties and their policies.
Quality of survey
The quality of the survey may be limited, due to the way the survey is carried out. The response we get from our target population may vary as the effort in answering the questions might change from person to person, e.g. we may get a person who is wide awake and knows everything about the general elections and then we might get data from someone else who is half asleep and has little knowledge on the general elections.
When answering question 11 in our group survey, we only gave our target population the option to choose one important issue and we have limited views from them, it would have been better to ask the target population this question, from one to five give your views to which is the most important issue or issues? So we get a wider range of views of what our target population want.
Random Sampling or self selected data
If when the survey was taken and the people were self selected and not random sampled. We wouldn’t get the data we wanted to collect from our target population. We collected random data and we wanted random views from our target population so we could understand what issue/s they would prefer to have discussed at the next general election in 2005.
If we self select our target population and we choose to ask the questions to a target group of all students or people aged 65+ we would get similar views on some of the issues. E.g. a student moans about finance all the time so they would complain about petrol prices, tax and student loans. A person who is 65+ may be interested in public transport, National Health Service and joining the euro. So our data wouldn’t be very random at all. We looked at getting views from a wide range of different people.
Personal Questions
We were limited to how far we could delve into people’s lives, so we didn’t upset them by being too nosy. We made simple questions that didn’t need names, address or any other personal data, just whether they were male or female and what age group they would fall under. Simple questions the target population would be happy to answer.
How did the Group Work?
I personally feel that the group could have contributed a lot more than they actually did. I issued timescales and deadlines, all of which were very rarely met and chasing members of the group for information and completition of their assigned sections of the report became very exasperating.
We started out with the group designing their individual questionnaires, myself and person N, had designed our questionnaires whilst the other members of the group Person R and Person A had still to come up with any questions at all. So with only 4 weeks to go Person N and myself decided that we would combine the questions that we had come up with, as we could see real possibilities that the group would not have time to gather the information and process it before hand in time.
I collated the questions in Excel and issued copies of the spreadsheet to the other members of the group. The following week I asked how many questionnaires had been completed and the answer was somewhat limited. I was ready to present the data that I had gathered and so I tallied my information up, the others were asked to ensure that they had gathered their information by the next week (2 weeks to hand in).
At the 2 week to hand in stage, the questionnaires I requested were given over to me to tally up the results. I decided that due to the lack of interest shown by person A and Person R that it would be best to take on the responsibility for collating the information, or I could see it not getting done. I collated the data and drew up some of the charts and most of the report in the tutorial lesson, and asked Person R to take care of the Parameters section of the report and Person A to take care of the predictions section. Person N was responsible for the limitations section of the report, whilst I prepared the rest. Person A completed his section that day and handed it over for amalgamation into the main report, as did Person N, however yet again Person R did not hand in anything, I asked him to email me over the weekend the results, however nothing arrived. I asked Person R when I arrived on Tuesday, and he stated that he had been busy working all weekend, and had not had the time to complete it, so I reminded him that the work was due in 2 days from then, and that if the section he was working on was not handed in with the report, we would lose marks as a group. With one day to go I have just been handed the information for parameters from Person R.
I feel that it isn’t fair to penalise the rest of the group (well myself and Person N really!!) due to the neglect of the other members of the group, and some of their inabilities to use basic time management skills to prepare their workload. It does seem to be a re-occurring flair within certain members of the group to ensure that work due to be handed in is prepared at the very last minute available.
Now this may seem as if I’m saying that I did most of the work on this report, and if I’m being honest, I probably did, and that was because I could see us handing in nothing of value, and I am on this course to pass. If we could do it all over, I’d ensure a better enforcement of deadlines was adhered too, greater group participation and that there was improved communication between members of the group.
Appendices
Appendix (A) Graphical Representation of Data
Within this appendix is a selection of the charts that we have compiled based on the information we received for each question we asked.
Appendix (B) Questionnaire
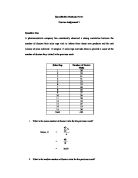
Question Answer Selection No. of Responders
Question Answer Selection No. of Responders