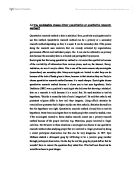
Steps in Hypothesis Testing
Practical Examples
The data set was collected from one of the supermarket (local store near my flat) in Cyprus and the amount the customer spends was assumption that I made as they told me that the information regarding the profit and sales is their privacy and thus not allowed to give me. A week before one of my friend and I went to the store and collected the data asking some customer and the store keeper. The objective of this study was to test whether being vegetarian influences the amount spent in Supermarket store. An independent sample t-test was chosen as the methodology to investigate such hypothesis.
The t-test allows to compare two means from different consumer groups and test the null hypothesis that the two means are equal. If the probability of the t-statistics falls below a threshold level (set at 0.05, i.e. 5%) then the null hypothesis is rejected in favor of the alternative.
The t-test is based upon the normal distribution of the target variable (i.e. amount spent) within each of the groups. If the sample size is reasonably large (>40-50 units) it is possible to exploit the normal approximation.
The t-test was carried out to check whether the following customer characteristics led to statistically significant differences in the group means:
-vegetarian
-use coupon
-gender
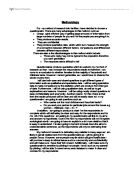
The given below summarized the output of the One Samples T-test.
Figure 2
Figure 3
The null hypothesis is not rejected (as the p-value is larger then 0.05).
It shows that the t-statistic for the vegetarian characteristic has a p-value of 0.66.As this p-value is above 0.05, the null hypothesis of equal means can not be rejected. This means the vegetarian factor is not influencing the amount spent. However, the mean comparison hypothesis test doesn’t not take explicitly onto account the potential influence of other disturbing factors (e.g. store size). Partial correlation and regression analysis could give further information in that direction, but for the objective of this study and given the very high p-value we can confidently assume that the t-test result are reliable.
This study showed that being vegetarian is not an influential factor in determining the amount spent, while there are significant difference in terms of gender and the use of the coupon. More specifically, the average amount spent for male/female and user/non user of coupon. It looks that the amount spent by men is significantly higher, and also the use of coupon lead to a higher expenditure.
A better method for comparing several population means is an analysis of variance, abbreviated as ANOVA.
ANOVA test is based on the variability between the sample means. This variability is measured in relation to the variability of the data values within the samples. These two variances are compared through means of the F ratio test.
If there is a large variability between the sample means, this suggests that not all the population means are equal. When the variability between the samples means is large compared to the variability within the samples, it can be concluded that not all the population means are equal.
The tests used in the testing of hypothesis, viz., t-tests and ANOVA have some fundamental assumptions that need to be met, for the test to work properly and yield good results. The main assumptions for the t-test and ANOVA are listed below.
The primary assumptions underlying the t-test are:
- The samples are drawn randomly from a population in which the data are distributed normally distributed.
-
In the case of a two sample t-test, δ12 = δ22.Therefore it is assumed that s12 and s22 both estimate a common population variance, δ2. This assumption is called the homogeneity of variances
-
In the case of a two sample t-test, the measurements in sample 1 are independent of those in sample 2.
Like the t-test, analysis of variance is based on a model that requires certain assumptions.
Three primary assumptions of ANOVA are that:
- Each group is obtained randomly, with each observation independent of all other observations and the groups independent of each other.
- The samples represent populations in which the data are normally distributed.
-
δ12 = δ22 = δ32 = ... = δk2. The assumption of homogeneity of variances is similar to the discussion above under the t-test. The group variances are assumed to be an estimate of a common variance, δ2.
In actual experimental or sampling situations, the underlying populations are not likely to be exactly normally distributed with exactly equal variances. Both the t-test and ANOVA are quite robust and yield reliable results when some of the assumptions are not met. For example, if n1 = n2 = ... = nk, ANOVA tends to be especially robust with respect to the assumption of homogeneity As the number of groups tested, k, increases there is a greater effect on the value of the F-statistic. It is also seen that a reasonable departure from the assumption of population normality does not have a serious effect on the reliability of the F-statistic or the t-statistic. It is essential however that the assumption of independence be met. The analysis is not robust for non-independent measurements. These factors are to be taken into consideration while testing hypotheses.
Limitations for Environmental Sampling
Although hypothesis tests are a very useful tool in general, they are sometimes not appropriate in the environmental field. The following cases illustrate some of the limitations of this type of test:
A) Multiple Comparisons
z and t tests are very useful when comparing two population means. However, when it comes to comparing several population means at the same time, this method is not very appropriate.
Suppose we are interested in comparing pollutant concentrations form three different wells with means m1, m2 and m3. We could test the following hypothesis:
H0: m1 = m2 = m3
HA: not all means are equal
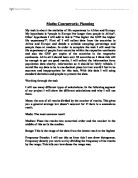
We would need to conduct three different hypothesis tests, which are shown here:
Figure 4.Hypothesis tests needed for testing three different populations
For each test, there is always the possibility of committing an error. Since we are conducting three such tests, the overall error probability would exceed the acceptable ranges, and we could not feel very confident about the final conclusion. Table 8 shows the resulting overall a if multiple t tests are conducted. Assume that each k value represents the number of populations to be compared.
Summarize
Figure 5
Figure 6
Frequencies
Figure 7
Figure 8
Histogram
Figure 9
Data View From SPSS
Variable View From SPSS