Investigating Seed Germination.
Results
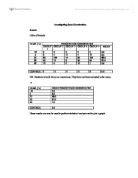
Table of Results
TEMP. (?c)
PERCENTAGE GERMINATED
GROUP 1
GROUP 2
GROUP 3
GROUP 4
GROUP 5
MEAN
-10
0
0
0
0
0
0.0
4
8
4
2
6
0
8.0
22
80
00
74
86
00
88.0
30
60
74
8
96
94
81.0
40
0
6
0
0
2
5.6
CONTROL
0
0
0
0
0
0.0
NB. Numbers in bold italics are anomalous. They have not been included in the mean.
==>
TEMP. (?c)
MEAN PERCENTAGE GERMINATED
-10
0.0
4
8.0
22
88.0
30
81.0
40
5.6
CONTROL
0.0
These results can now be used to perform statistical analysis and to plot a graph.
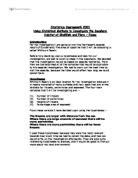
Analysis
To determine whether temperature has had an effect I shall use the Chi-Squared (?2) Test for Goodness of Fit.
The Chi-Squared Test is used to determine whether the actual results of the experiment confirm the null hypothesis stated.
For this investigation, the null hypothesis would be; 'temperature has no effect on the percentage of seeds that germinate'
Whereas the alternative hypothesis would be; 'temperature does have an effect on the percentage of seeds that germinate'
Results
Table of Results
TEMP. (?c)
PERCENTAGE GERMINATED
GROUP 1
GROUP 2
GROUP 3
GROUP 4
GROUP 5
MEAN
-10
0
0
0
0
0
0.0
4
8
4
2
6
0
8.0
22
80
00
74
86
00
88.0
30
60
74
8
96
94
81.0
40
0
6
0
0
2
5.6
CONTROL
0
0
0
0
0
0.0
NB. Numbers in bold italics are anomalous. They have not been included in the mean.
==>
TEMP. (?c)
MEAN PERCENTAGE GERMINATED
-10
0.0
4
8.0
22
88.0
30
81.0
40
5.6
CONTROL
0.0
These results can now be used to perform statistical analysis and to plot a graph.
Analysis
To determine whether temperature has had an effect I shall use the Chi-Squared (?2) Test for Goodness of Fit.
The Chi-Squared Test is used to determine whether the actual results of the experiment confirm the null hypothesis stated.
For this investigation, the null hypothesis would be; 'temperature has no effect on the percentage of seeds that germinate'
Whereas the alternative hypothesis would be; 'temperature does have an effect on the percentage of seeds that germinate'