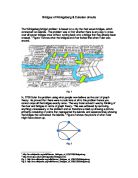
Diagrams showing my investigation
Summarizing of the 6 lines that I drew with the formulas
Patterns I managed to spot while investigating
While undergoing the investigation I found numerous amount of patterns e.g. the relationships between open & closed regions. The following information will give you insight information about what I managed to find i.e. the relationship between open and closed regions.
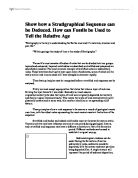
Table shows relationship between open and closed regions
From the above table I can gather that the number of closed regions for any particular number of lines is less than the number of open regions for the same number of lines. The number of open regions is double than the number of line. But there isn’t any particular relationship between the number of lines and the number of closed regions which can be gathered from this table. However, there is an extra row which shows the difference between the open region and the closed regions for any particular number of lines and this shows a pattern. The difference goes up for the first three lines, where it peaks. Following on from that it remains constant for one more line after which it starts to decline in the same pattern as it increased.
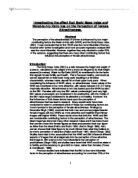
Table shows relationship between open and total regions
Table shows relationship between closed total regions
The nth term
The nth term is useful in order to predict the next number in any particular sequence without actually going through the trouble of working it out, which in this case means drawing the lines and counting the number of open regions for example. It can be worked out by using the formula below:
A+B (n-1) +0.5(n-1) (n-2) C
Where,
A = 1st term in the sequences below.
B = The 1st difference between the two different terms in the sequences below.
C = the 2nd difference in the sequences below which is always constant.
Working out the nth term for closed regions
Sequence 0 0 1 3 6 10
1st Difference 0 1 2 3 4
2nd Difference 1 1 1 1
Consequently,
A = 0
B = 0
C = 1
The equation for closed regions is = 0+0(n+1) +0.5(n-1) (n-2)1
Simplified = (0.5n2)-(1.5n) +1
Formula for nth term = 0.5n2-1.5n+1
Working out the nth term for crossover points
Sequence 0 1 3 6 10 15
1st Difference 1 2 3 4 5
2nd Difference 1 1 1 1
Consequently,
A = 0
B = 1
C = 1
The equation for crossovers is = 0+1(n+1) +0.5(n-1) (n-2)1
Simplified = (0.5n2)–(0.5n)
Formula for nth term = 0.5n2 -0.5n
Working out the nth term for total regions
Sequence 2 4 7 11 16 22
1st Difference 2 3 4 5 6
2nd Difference 1 1 1 1
Consequently,
A = 2.
B = 2
C = 1
The equation for total regions is = 2+2(n+1) +0.5(n-1) (n-2)1
Simplified = (0.5n2) + (0.5n) +1
Formula for nth term = 0.5n2+0.5n+1
Working out the nth term for open regions
Sequence 2 4 6 8 10 12
1st Difference 2 2 2 2 2
2nd Difference 0 0 0 0
Consequently,
A = 2
B = 2
C = 0
The equation for open regions is = 2+2(n+1) +0.5(n-1) (n-2)0
Simplified = 2n
Formula for nth term= 2n
Working out the nth term for the relationship between open and closed regions
Sequence 2 4 5 5 4 2
1st Difference 2 1 0 - 1 -2
2nd Difference 1 1 1 1
Consequently,
A = 2
B = 2
C = 1
The equation for the relationship between open and closed regions = 2+2(n+1) +0.5(n-1) (n-2)1
Simplified = (0.5n2) + (0.5n+1)
Formula for nth term = 0.5n2+0.5n+1
Working out the nth term for relationship between open and total regions
Sequence 0 0 -1 -3 -6 -10
1st Difference 0 1 2 3 4
2nd Difference 1 1 1 1
A = 0
B = 0
C = 1
The equation for the relationship between open and total regions = 0+0(n+1) +0.5(n-1) (n-2)1
Simplified = (0.5n2)-(1.5n+1)
Formula for nth term = (0.5n2)-(1.5n+1)
Working out the nth term for relationship between total and closed regions
Sequence -2 -4 -6 -8 -10 -12
1st Difference 2 2 2 2 2
2nd Difference 1 1 1 1
A = -2
B = 2
C = 1.
The equation for relationship between closed and total regions is:-2+2(n+1) +0.5(n-1) (n-2)1
Simplified = -2n
Formula for nth term= -2n
Conclusion
From my results I can gather that my hypothesis were correct. For any particular number of lines the open region was double it. This had to be the case because if a line was to be drawn then it will form a barrier between two regions on either side, i.e. there will be two regions for any one line. Similarly if you were to have two line than the two line will make up four open regions on either side of each of the two line present. Therefore, when two lines were present then the number of open regions was four.
I also predicted that the relationship between open regions and closed regions will be a sequence that has a 1st difference and a 2nd difference and it was. There was also always a greater number of closed regions in comparison to open and finally the number of total regions was also always greater than the number of crossover points.
Evaluation
In my opinion my investigation went quite well. I was able to prove my hypothesis correct and was able to fulfil my aim of working out the nth term for many regions.
It took me a while to draw the diagrams as I wanted each crossover to give me the maximum number of open and closed regions. But once I had the diagrams, I simply put the results in a table and then looked for any obvious or underlying sequence.
Problems and hurdles I faced while undergoing the investigation:
- I had a bit of a problem trying to make sure that I didn’t double intersect the lines because if I did that would have ruined all my investigation as it wouldn’t have been a fair examination to make sure I didn’t do this I double checked all my lines before I went ahead in the investigation.
- I also had a bit of a problem trying to find a complex pattern but after a while I managed to find it.
How would I improve my investigation next time:
- I would give my self a longer time span in order to complete my investigation which will help me enhance the quality of my work.
- I would try to find more complex patterns in order for me to do this I will have analyze all my work more carefully.
Bibliography
-
- Class work
- CGP intermediate-GCSE maths revision guide / book