Figure 1 The Mechanic feature
Figure 1 shows that workers with different experience share nearly the same amount of the jobs.
Figure 2 The Difficulty feature
Figure2 shows that nearly 60.8% of the repairing jobs are standard, 28% of the jobs are easy, and the hard jobs are the least, which account for 11.3%.
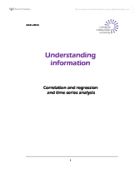
Table 3 Frequencies by level of Difficulty and Mechanic
Table 3 shows the frequencies by level of Difficulty and Mechanic. From row 2, the percentage represents the row percentage, and the number in the bracket is the real amount. The last row and the last column show the row and the column totaling. The table suggests that the non-skilled workers do most of the easy jobs and the skilled workers finish most of the hard jobs.
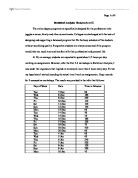
Figure 4 The histogram of the repairing time
Figure4 demonstrates the frequency distribution of the repairing time.\The workers spend nearly 33 minutes to finish their repairing job, and the repairing time mostly ranges from 10 minutes to 60 minutes. When dividing the time into several groups and the interval length is 10 minutes, the following bar chart is the case:
Figure 5 The bar chart of the repairing time
Table 6 Frequencies by level of Difficulty
The above table demonstrates the basic information on the time by level of difficulty. The table suggests that as the problems become harder, the workers need more time to settle them down. The Min and Max column of the above table also suggest that sometimes the dispatchers may mistakenly classify the easy jobs into the standard or the hard jobs.
Table7 The average time by level of Difficulty and Mechanic
The above table gives the average time spent on the different levels of jobs by workers with different experience. The second and the third rows show that there are no significant differences for the average time when different workers do the easy or the hard jobs. When doing the hard jobs, the skilled and the very skilled workers always spend 10 more minutes to finish the jobs. The last row reflects the total average time spent by workers with different experience, which suggests that except for the skilled workers, other workers’ efficiencies are almost the same. The skilled workers spend 10 more minutes to finish the job, partly because they spend more time on the hard jobs.
Forming and maintaining good relationship with customers is good to enhance the chance of the repeat business. The satisfaction survey is used to investigate customers’ attitude into the company.
Figure 8 The customer satisfaction
The above pie chart shows customers’ attitude toward the service. When taking the customers who did not give any response into account, the amount of customers who are satisfied or very satisfied with the service takes up nearly 77.1%, which do not meet the target of the company. When wiping out the part with no response, the percentage rises up to 80.7%. Then we will explore what factors affect the customers’ satisfaction.
Table 9 The frequency by level of customer satisfaction and Difficulty
The cross-table describes the relationship between Customers’ attitudes with the job difficulty. The table suggests that most dissatisfactory services are the easy and the standard jobs, which accounts for 83.3% of the total dissatisfactory amount. Hence, improving the service quality in the easy and standard jobs is of great help to increase the satisfaction rate.
Table 10 The frequency by level of customer satisfaction and Workers with different experience
The table shows the customers’ attitude toward the service by workers with different experience. The satisfaction rates for the very skilled, skilled, semiskilled, unskilled are 78.6%, 85.7%, 74.7% and 71.3%. When excluding the non-response customers, the rates are 83.1%, 90%, 77.8% and 74.0%. The service quality is significantly different among different workers. Among the dis-satisfied jobs, 14 and 18 pieces are done by the semiskilled and the unskilled, which account for 68.9% of the total 47. Hence, in order to improve the service quality, the company should take some measures to increase the service level of the unskilled and the semi-skilled.
Conclusion
From the above analysis, we conclude that the efficiency and effectiveness are significantly difference among workers with different experience. Although the skilled workers spend more time on the work, their service is the most satisfactory. The customers’ overall satisfaction rate is slightly below the company’s target, and the satisfactory rates are different among workers with different experience. In order to boost the satisfactory rate, the company should strength the quality control on the easy and standard jobs, and it should enhance the service quality of the workers with little experience.
References
Etheridge, D. 2007, Excel 2007 Data Analysis: Your visual blueprint™ for creating and analyzing data, charts, and PivotTables, NY: Wiley Publishing.
Derek, R. A. 2004, Customer satisfaction research management: a comprehensive guide to integrating customer loyalty and satisfaction metrics, ASQ Quality Press.
Jankowicz, A. D. 1991, Business Research Projects for Students, London: Chapman &Hall.
Paul R. Kinnear & Colin D. Gray. 2008, SPSS 16 made simple, London: Psychology Press.
Pervez Ghauri & Kjell GrØnhaug 2005, Research methods in business studies: a practical guide, 3rd Edition, NJ: Prentice Hall.
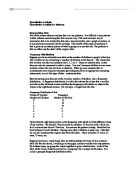
For simplification, I rename the variable Mechanic: very skilled=1, skilled=2, semiskilled=3, unskilled=4