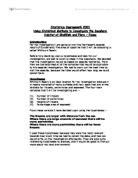
- State the null and alternative hypotheses. The null hypothesis is a hypothesis about a population parameter. It is often the reverse of what the experimenter actually believes; it is put forward to allow the data to contradict it.
- Select the level of significance. This is the probability of rejecting the null hypothesis when it is true. It is also sometimes called the level of risk
- Determine the test statistic.
- Formulate the decision rule.
- Select the sample, perform the calculations, and make a decision.
The specific steps for this case are defined below:
Step 1: The null hypothesis is that I spend 2 hours or less on homework. The alternate hypothesis is that I spend more than 2 hours on homework.
H0: µ ≤ 120 min.
H1: µ > 120 min.
Step 2: Traditionally, the .05 level is selected for consumer research projects.
α = .05
Step 3: The t distribution is the test statistic for a population with unknown standard deviation and when there are fewer than 30 observations.
Step 4: This is a one-tailed test with 20 degrees of freedom, found by n-1=21-1=20. The critical t = 1.725. Therefore, the null hypothesis will be rejected if the value of t is greater than 1.725
Step 5: For the calculations I used the MegaStat software. The results are provided below:
The results show that the computed t-value (0.72) is less than the critical value (1.725). Also, the p-value (.24) is greater than the significance value (.05). I cannot reject the null hypothesis. There is not sufficient proof that I spend more than 2 hours on homework every day. Based on this conclusion I would recommend this form of education to colleagues and friends. With good time management and self discipline professionals should be able to successfully participate in a quality online degree program.
Next, I tested if the program is well balanced. I wanted to see if I am equally busy throughout the week. For the analysis of the data I used the Analysis of Variance (ANOVA) technique. ANOVA tests simultaneously whether the means of several populations are equal. By simultaneously testing all populations, error buildup is avoided. The ANOVA test follows the standard five-step hypothesis testing procedure too.
Step 1: The null hypothesis is that there is no difference between the mean numbers of hours I study every day of the week. The alternate hypothesis is that the means are not all the same for the seven days of the week.
H0: µMo = µTu = µWe = µTh = µFr = µSa = µSu
H1: The means are not equal
Step 2: I use again the .05 level of significance.
Step 3: The F distribution is the test statistic for ANOVA tests. The F distribution is the distribution of the ratio of two estimates of variance. It is used to compute probability values in ANOVA.
Step 4: F has two parameters: degrees of freedom in the numerator (dfn) and degrees of freedom in the denominator (dfd). The dfn is the number of degrees of freedom that the estimate of variance used in the numerator is based on. The dfd is the number of degrees of freedom that the estimate used in the denominator is based on.
dfn = number of treatments – 1 = 7 days – 1 = 6
dfd = total number of observations – number of treatments = 21 – 7 = 14
The critical value for F is 2.85. So, the decision rule is to reject the null hypothesis if the computed value of F exceeds 2.85.
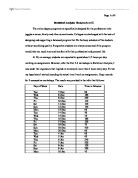
Step 5: To be able to use the MegaStat software for the calculations I organized the data in the following table:
The results are presented in the two tables below:
The computed value of F (3.92) is greater than the critical value of F (2.85). Also, the p-value (.0165) is smaller than the level of significance (.05). I have to reject the null hypothesis. At the .05 level of significance there is a difference in the number of hours I study every day. The Post hoc analysis shows that on Thursdays and Sundays I spend more time on assignments than on Mondays and Tuesdays. The time I study on Saturdays differs from the time I study on Mondays and Thursdays. The details of the Post hoc analysis are provided in the table below:
The results show that I work longer on some days of the week. On such days most likely I use the Blackboard system more, call help desk if need be, and write the facilitator with questions. The implication this has on IU is that its staff and equipment have to be prepared and able to meet students’ increased needs for support. This applies to class facilitations, help desk support, and administration. Before taking any specific measures, however, I would recommend that IU conducts a more extensive analysis that applies proper sampling techniques and more precise measuring tools.