Assessment of Indoor Environment.
University of Brighton
School of the Environment
Built Environment Area
2001-2002
BE240 INDOOR ENVIRONMENT 2
Assessment of Indoor Environment
Student No. 98209214
Neil Anstee
Introduction
Thermal comfort
A description, "the condition of mind that expresses satisfaction within the environment."
CIBSE Guide Section A 1999
The factors that can determine comfort, are, measured singularly yet will work in combination. Thus giving us our indoor micro climate.
An indoor climate is heavily influenced by the outdoor climate, and the combination of these factors determines what a humans judgement may be.
Many scientists, rely on systematic analysis of thermal sensations. Yet in some ways one can obtain suitable judgement in public places, of getting experimental subjects to express their perception of the thermal environment, on a suitable scale while an experimenter measures their actual thermal environment.
Light Environment
Light, besides being indispensable for visual perception of the surrounding space for where work and leisure, also regulates metabolic and immuniological processes in the human body.
Many artificial light sources do not produce the same photochemical responses in man as natural daylight. New layout concepts for relatively new buildings, produce deep rooms with low ceilings, (similar to that of the two canteens, 'Mezzanine' and 'Mithras House'), yet require artificial lighting to be on all day.
Illuminance is the quotient of the luminous flux incident on an element of the surface containing a point by the area of that element. Luminance is the flux of light energy emerging in a small solid angle in given direction form a small element of an area on the surface per unit apparent area per unit solid angle.
Noise Environment
In general it is believed that most noise to buildings comes from the ambient external environment.
Noises can be divided into constant and variable noises. Constant noises can be pumping, ventilation, kitchen machinery, or any thing that will be constantly working.
To evaluate noise one must understand the character of the noise to be assessed. I.e. constant/variable. Acoustical Standardisation Internationally is the responsibility of the International Standards Organisation.
In modern buildings about 30 types of noise generating equipment has been identified, producing levels of 45-60DbA. It can be higher in cases where very low sound dampening materials have been used in the structure.
Indoor Air Quality
Air is influenced by quality of indoor air pollutants and quality of outdoor air coming in. This can be screened, filtered or washed. Some volatile and particulate pollutants are emitted form the occupants themselves, others may originate from tobacco, combustion products from cooking, heating, lighting gaseous and particulate compounds from building materials and decorations, furnishings, aerosol sprays, insecticides, pesticides, nucleotides such as radon, live and dead micro-organisms and decay products from low organisms e.g. moulds and fungi.
The concentration Indoor Air Quality (IAQ) depends on ventilation rate of air changes.
Indoors combustion systems used for cooking and heating are frequently the cause of severe indoor pollution. The principle fuels used are wood, charcoal, coal and coke, natural gas, propane and kerosene (although of today electric use is more popular). An important basic distinction can be made between flued systems and unflued systems however. On health grounds, a very strong preference must be expressed for flued systems. The combustion products are monoxide, carbon dioxide, formaldehyde, and smoke, the constituents of which will depend on the nature of the fuel, and the conditions of the combustion (NRC, 1981).
Part One. Subjective Assessment and Comparisons
The initial research that I carried out showed me that in each of the four areas to be examined, i.e. Thermal comfort, visual and acoustic comfort as well as the air quality within the space, a respected measurement of these criteria's is by an occupant's perception.
Therefore to do this myself I chose to record my perceptions of two different canteens, to form a comparison, and also to visit the sites at known busy periods and at known quiet periods. Thus, to gain an understanding of the environments, when being used for their purpose. Further to this, I felt it suitable to do assessments at North, South, East and West sides of the canteens, thus to gain an understanding of the effect from windows, air conditioning units, density of occupants, cooking or food preparation areas and exits.
THE CANTEENS
Mezzanine Canteen, Cockcoft Building (Mezz)
Mithras House Canteen, Mithras House.
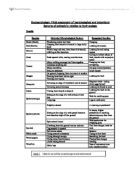
The following perceived results contain, descriptions of the quality of each of the conditions.
On thermal comfort, I have used a method known as the PMV, (Predicted Mean Vote). This is a measure of the average response from a large group of people voting on a scale from -3 to +3.
The PMV can be calculated from Fanger's comfort equation, which combines air temperature, mean radiant, relative humidity and air speed, together with estimates of activity and clothing levels. The Percentage People Dissatisfied provides a measure of the percentage of people who will complain of thermal discomfort in relation to PMV.
Shown in the graph below, calculated from,
PPD = 100 - 95 exp (10.03353 PMV4 - 0.2179 PMV²)
Sourced from, http://www.innova.dk/books/thermal/thermal.htm#14
The implication of PPD is that there is no condition where everyone will experience optimum comfort conditions. So to calculate the percentage of the people who will be dissatisfied, it was introduced. It predicts that there will always be 5% of people who will report discomfort.
Source: AJ Metric Handbook, 1999.
QUIET PERIODS Mezzanine Canteen.
ORIENTATION
THERMAL COMFORT
LIGHT
NOISE
INDOOR AIR QUALITY
SOUTH
-0.5
Fairly fine at SE part as near to windows. In opposite corner slightly duller but artificial light quite effective.
Fine. But noise will travel as wide-open canteen.
Air velocity seems o.k. but stale smell lingers.
EAST
-0.5
Bright and fine.
Noise form air con units. Sounds from people in the canteen.
Fresh but similar to south.
NORTH
-0.5/0
...
This is a preview of the whole essay
Source: AJ Metric Handbook, 1999.
QUIET PERIODS Mezzanine Canteen.
ORIENTATION
THERMAL COMFORT
LIGHT
NOISE
INDOOR AIR QUALITY
SOUTH
-0.5
Fairly fine at SE part as near to windows. In opposite corner slightly duller but artificial light quite effective.
Fine. But noise will travel as wide-open canteen.
Air velocity seems o.k. but stale smell lingers.
EAST
-0.5
Bright and fine.
Noise form air con units. Sounds from people in the canteen.
Fresh but similar to south.
NORTH
-0.5/0
Fine but dull to the west.
Sound of units and kitchen areas.
Smell of stale air form cooking.
WEST
-0.5/0
Good artificial lighting, but difference compared to east side.
Similar to west.
Stale air mainly.
QUIET PERIODS Mithras House Canteen.
ORIENTATION
THERMAL COMFORT
LIGHT
NOISE
INDOOR AIR QUALITY
SOUTH
0
Dull and dark
Close to exit therefore can lobby.
Fresh.
EAST
-0.5
Particularly dull. Dull colours on walls and ceilings. Lighting has little effect.
Air con system constant noise.
At NE smell of cooking. Quite stale all round.
NORTH
0
Fairly dark. Low ceilings due to air con units. Artificial lighting has little effect. Eyes struggle.
Again o.k. But further constant noise from air con units.
More smell of cooking.
WEST
-0.5
Fairly pleasant. Lighting has lack of effect compared to daylight. Low ceiling holds air con units.
Fine. Quiet. Silent machinery.
Fresh due to windows, and air con combined.
BUSY PERIODS. Mezzanine Canteen.
ORIENTATION
THERMAL COMFORT
LIGHT
NOISE
INDOOR AIR QUALITY
SOUTH
0
Fine, lighting seems to be effective and weather o.k. so windows help light.
All round noise, that seems to come from all over the canteen.
Food smells obvious, but nothing terrible.
EAST
0
Bright and fine.
Noise from air con units and quite loud sounds from people in canteen.
Fresh but similar to the south.
NORTH
Fine but dull at side with no windows.
Sounds from people queuing, and kitchen activities.
Smell of food.
WEST
Dull area of canteen. Quite good artificial lighting.
Similar to the east area.
Food smells mainly.
BUSY PERIODS. Mithras House Canteen.
ORIENTATION
THERMAL COMFORT
LIGHT
NOISE
INDOOR AIR QUALITY
SOUTH
0
Dull and gloomy.
Reasonable to loud.
Seems fresh but smell of food clear in the air.
EAST
0
Dull area and the light seems to struggle to have any effect.
Air con system creates a constant noise.
Towards the north are you get a clear smell of cooking, which is less as you move towards the south area.
NORTH
0
The low ceilings due to the air con units, leave the area quite dark, and the artificial lighting has little effect.
o.k. but still the noise from the air con units, combined with the people in the canteen creates for a loud all round noise.
Obvious smells from cooking and foods.
WEST
Windows bring in quite a lot of heat from solar gain, and are also bright.
Fine.
Clearly fresher due to the ventilation from windows plus the brighter the light the fresher you feel.
Part Two. Design Specifications.
Taken from, CIBSE Guide A - Environmental Design. (1999)
The design criteria gives general guidance and recommendations on suitable winter and summer temperature ranges, outdoor air supply rates, filtration grades, maintained illuminances and noise ratings for a range of room and building types.
Recommended Comfort Criteria for Specific Applications.
Building/Room type Restaurant/dining room
Winter Dry Resultant Temperature Range for stated activity and clothing level
Temp - 22-24 degrees Celsius
Activity - 1.1 met
Clothing - 0.9 clo
Summer Dry Resultant Temperature Range for stated activity and clothing level
Temp - 24-25 degrees Celsius
Activity - 1.1 met
Clothing - 0.65 clo
Suggested air supply rate (l/s-¹/person except where stated otherwise) 8
Filtration grade F5 - F7
Maintained Illuminance 50 - 200 (dimming required)
Noise Rating 35 - 40
Humidity is less well defined than temperature. In normal circumstances humidity in a range between 40 - 70% is acceptable.
For comfort, indoor air quality may be said to be acceptable if
a) not more than 50% of occupants can detect an odour
b) not more than 20% experience discomfort
c) not more than 10% suffer from unusual irritation
d) not more than 5% experience annoyance for less than 2% of the time.
Ref: 1) Ventilation for acceptable IAQ ANSI/ASHRAE Standard 62 - 1989 (Atlanta: American Society of Heating, Refrigeration and Air Conditioning Engineering) 1989. 2) Air Quality Guidelines for Europe (Copenhagen: World Health Organisation)
Also air changes of 18-litres/second.
For locations where food is prepared or served, the Food Hygiene (General) Regulation 1970 requires, "suitable and sufficient means of lighting. In order that proper cleanliness can be maintained and the local authority (which is responsible for enforcement of these regulations) should be consulted regarding the specific standards which apply. For pleasantness, it's established that working environment lit to less than 200 lux tend to be rated as satisfaction for continuous occupation. The CIBSE Code for interior lighting recommends this value as a minimum amenity level in continuously occupied spaces.
Suggested max permissible background noise levels generated by building services installations (BS 8233).
For Restaurants, shops and stores:
- night club, public houses, café, canteen, department store > 40-45 NR
CIBSE Guide B12 discusses Sound Control of Building Services.
Sourced from:'Table 1.2 Location of Detailed Guidance to Environmental Criteria.'
Part Three. Equipment required, and Methodology used to Evaluate the Indoor Environment.
Thermal Comfort
Thermal comfort is affected by six factors,
. Air temperature Environmental factor
2. Moisture Content Environmental factor
3. Air velocity Environmental factor
4. Mean Radiant Temperature Environmental factor
5. Activity Human factor
6. Clothing Human factor
The four environmental factors can be measured of the environment it self, that you wish to know about. Whereas the human factors can be measured, but only with regards to the individual persons who are within the environment.
To measure the air temperature, one would usually use a dry bulb thermometer, which should be hanging in a free position. Though modern technology has produced electronic thermometers. They are often combined with hydrometers. Values are read for precision to the tenth of a Celsius.
To record continuous readings thermographs can be used. Surface temperatures too, are generally different to the air temperatures, and these can be measured with fine wire thermocouples attached with tapes to the surface.
Depending on how you want to measure the air temperature whether it is at a certain point in time or continuously over a period of time, you can use the instruments mentioned above. However for most situations it is advisable to properly shield the temperature-measuring device from the radiation field. A mercury thermometer with its bulb in the sunlight will not measure the indoor air temperature.
To measure the humidity (moisture content), you measure the dry and wet bulb temperatures using the mounted. The Sling Cyclometer is a hand held instrument which consists of two thermometers of which one is covered with a wetted wick exposed to an air stream passing over it and the other wick dry. This Assmann type psycrometer is suitable inside areas that are sheltered from radiation.
Humidity, water vapour pressure, and dew-point are then read from tables like the psycrometric chart from CIBSE Guide's.
To continuously measure an environment, hydrographs can be used, yet their reliability is flawed unless they are kept carefully calibrated. But to measure the humidity at a particular moment in time one can use the hand held sling.
To measure air velocity an instrument known as a Kata Thermometer is used. This works in a way that it measures two points of temperature. The first measurement is from a wet point and the second point is the cooled temperature. There fore the velocity is measured by establishing the cooling rate between these two measurements.
On experimenting with this device I would not describe it as particularly accurate. Due to the fact that air velocity's inside rooms are generally low. Precision electrical hot wire anemometers may be suitable to determine air streams of velocities as low as 50mm/s and their direction.
To measure the Mean Radiant Temperature, or the Long Wave Radiation one uses what is known as a Globe Thermometer. The globe thermometer consists of a blackened hollow sphere of thin copper of 10 or 15 cm diameter, with a mercury thermometer inserted with its bulb placed at the centre of the globe, and the stem emergent. The blackened sphere absorbs the short wave and long wave radiation incident, and an equilibrium between gains and losses is established depending on the radiative field, and the rate of air movement over the surface of the globe. As long as the air temperature is known and also the rate of air flow the mean radiative flux can be derived from the globe temperature.
Due to the complexity of all the various temperatures upon the various surfaces within the indoor environment, we integrate all the values of the surfaces to find the mean value. The Mean Radiant Temperature is the temperature of a perfect black body enclosure that would produce the observed total flux of radiation at the observing point. Radiative fields are generally directional i.e. Sunlight, Beams from an electric fire.
Light Environment
Reflectance's within buildings vary widely, and patterns of luminance are so complex and difficult to describe, indoor lighting standards are stated for convenience in terms of illuminance. Yet still behind this method of specification, one needs a pattern of luminance as the basis for good lighting.
Illuminance is measured with a illuminance metre consisting of a colour corrected calibrated photoelectric cell. This cell must adjust to respond to the colour content incident of the light. The angle of incident is regulated by a specially dimensioned diffusing disc which is mounted in front of the cell. This is known as the cosine correction.
Cosine law of illumination
Source: McMullan, R. Environmental Science in Building. 5th Edition. 2002 Palgrave
The set-up for a typical illuminance field study, complete with floor-plan, table (30" ht.), and illuminance meter
.
Sourced from, http://www.pge.com/003_save_energy/003c_edu_train/pec/toolbox/tll/app_notes/illuminance.shtml
Pacific Gas and aElectric Company.
A further type of illuminance metre devised for daylight studies is the daylight factor metre. This metre consists of two colour and cosine corrected matched photocells: one cell is exposed horizontally outdoors to provide the overcast day outdoor illuminance, the other cell is used to measure the illuminance at different points indoors. The cells are connected in such a way that the ratio of the two signals is directly output.
Day light factor consists of three components,
. Sky component where light enters the indoor environment directly onto the working plane.
2. External Reflected component where light enters the indoor environment after reflecting off external surfaces.
3. Internal Reflected component where light enters the indoor environment and then reflects off surfaces in that environment.
Noise Environment
We classify types of noise sources by their distribution of sound pressure levels in different frequency bands and their patterns of change with time.
One must characterise the noise to be assessed prior to measuring the noise. Constant noise is measured as the sound pressure levels of decibels (Db) in octave bands with geometric mean frequencies of 63, 125, 250, 500, 1000, 2000,4000, 8000 Hz.
Man is most sensitive to noise in the range 1000 to 4000 Hz. Any lower or higher than these figures are perceived as quiet sounds.
In noise evaluation there fore, human sensitivity can be allowed for by a sounds weighting of energy. In the sound level meter there will be frequency, weighting filters.
There are three widely used weighting functions in metre scales known as A, B and C. A noise control inspector would generally use sound level meters, which incorporate the scale A weighting frequency, and give records in d BA.
Sound level meters usually incorporate a high quality microphone, followed by a pre-amplifier, and display the output signal on a voltmeter, with a non-linear recording scale that allows readings to be corrected to give values in d BA. The noise can be measured over a lengthy period in which case a mean value is given, or, in a permanent manner (for example in the last two seconds), but only the most recent seconds recording would be the most instantaneous value. A best known supplier in the field would be, Bruel & Kjaer. The sound level meter is the basic apparatus for quickly measuring the sound characteristics within an indoor environment.
* A and C Frequency Weightings
* Peak Hold Features
Wide ranging and accurate measurement tool for sound levels suitable for industry, school or home. Dual range covers 35 to 90dB, 75 to130dB with ±2dB accuracy and switch selectable A/C weightings. Outputs for direct audio and chart recording. Fast/slow selectable response, peak hold, and 3-1/2 digit display. Size: 9.5" x 2.7" x 1". Weight: 7.6 oz.
Sourced from, http://www.e-sci.com/genSci/6/1029/1066/10013.html
Construction of a Sound Level Meter.
Indoor Air Quality
Most indoor air quality monitoring systems have been mainly derived from the equipment used to measure industrial settings, and as a rule are not really sufficient for the office building or the home. To do these areas properly there must be sufficient sensitivity to measure low concentration pollutants that would affect the average person, other than that of say a factory worker.
Many air volume samplers, for example, filter too large a volume of air that it would change the air quality itself and may tamper or disfigure data. The intrusion of the monitoring equipment, is an important feature of a monitoring program.
From the source, Yocum, J. McCarthy, S. Measuring Indoor Air Quality, A Practical Guide. 1991. (Wiley), it discusses 5 basic indoor air monitoring approaches. The approaches may not however be relevant for all pollutants.
An Indoor Air Quality Meter from TSI Incorporated.
TSI's IAQ-Calc(tm) Meters investigate and monitor Indoor Air Quality (IAQ). The Model 8732 is a cost-effective meter for CO2 measurements. The Models 8760 and 8762 simultaneously measure and data log multiple parameters to monitor indoor air quality conditions. The Model 8760 measures CO2, temperature, humidity, and calculates dew point, wet bulb temperature, absolute humidity, humidity ratio and % outside air. The Model 8762 adds CO.
Sourced from, http://www.tsi.com/iaq/products/iaqcalc/iaqcalc.htm#logging.
Continuous monitors are a real time method that can calculate short term or long term averages. The method is carried out by samplers operating at fixed points inside or outside the structure. The use of these sampling tubes and manifolds and suitable valving and electronic control, means they can be used at multi points.
This is generally used to characterise indoor and outdoor pollutants.
Dynamic time integrated samplers collect the pollutants on absorbents, filters, plates over fixed periods of time and this would represent a fixed volume of air sampled. Cheaper than continuous, yet can also act in a sequential way.
However the samples would need laboratory tests.
Passive time integrated samplers unlike others do not require a pump to draw the air. Instead the characteristics and the dimensions of the sampler, the physical properties of the pollutants and the diffusion of the pollutant to a sensitive surface or sector of the sampling device senses the pollutant. Examples of these devices are diffusion tubes for NO² monitoring developed by Palmes et al. (1976)
Grab sampling used for indoor sampling where single, short term samples can adequately describe the indoor pollutant concentrations. Examples of this may be filling cylinders, or sealed cavity areas with the air samples for laboratory tests.
Personal monitoring devices establish the total exposure by individuals as they move about both in and outdoors. These may be dynamic where air is drawn by battery-powered pumps through the sampling system or passive as when the individual simply moves around. Wallace and Ott (1982) conducted an in depth review of personal monitors.
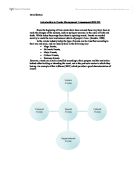
Development of a detailed design for indoor monitoring.
Sourced from: Yocom,J. Monitoring Indoor Air Quality. Wiley.1991
Part Four. Recommendations for improvements and how they can be achieved.
Thermal Comfort
I conclude from my subjective assessment in part one, that neither canteen was particularly uncomfortable to be in at either a quiet time or a busy time. Therefore I do not feel that there is any reason for specific improvements for the Mezzanine or Mithras house canteen's. Thermal comfort changes from individual to individual, in turn making it difficult to be sure as to what may be required and to what extent.
Ventilation of an area like a canteen, is of greatest importance. Therefore to create a canteen to be suitable, I recommend a more advanced idea of ventilating the space. This can be created by incorporating the use of natural ventilation as well as mechanical. Statutory regulations specify minimum rates of air supply in occupied spaces, and the rates of ventilation would depend on the volume and occupants in the room.
A Building Management System may be used to control windows and vents, at specified periods.
Mainly I feel improvement may be found in air conditioning or windows, in any case it cannot be forgotten that thermal comfort requirements imply the control not only of the quantity of air, but also of its temperature, its humidity and speed of movement.
Noise Environment
From my subjective assessment, I felt that both canteens were similar (maybe Mithras, more so) in that they both had obvious noises coming from what I assume were air conditioning units. This would be regarded as a continuous noise and to some may cause significant irritation. Also I did find that the surfaces did not do a great deal in absorbing speech noise.
Methods to over come the problem would be done by first assessing the situation, as mentioned in part three of this piece of work. Then, devices to deflect or absorb sound waves can be effective if they are placed close to the source, or close to the recipient of the noise.
An absorbent material could be placed around or close to air conditioning equipment. An example I found is a foam type material.
COUSTIFOAM is a foam with a fire classification to BS 476 Class 0. Designed for installation over metal or open cell ceilings, it gives good acoustic absorption and also screens the void, obscuring the services and soffit normally visible through this type of ceiling. Available in rolls, or modular sizes in flexible or rigid form.
Sourced from, Kinetics Noise Control Manufacturers Literature.
Light Environment
From my subjective assessment, I found that Mithras House canteen had a problem with lighting at the centre and to the east sides (as shown in the diagrams in part one). This I feel was due to lack of natural lighting and also low ceilings, which I assume was due to the containment of the air conditioning ducts.
I believe a better system of PSALI (Permanent Supplementary Artificial Lighting of Interiors) which is a combination of daylight and artificial light, is needed in the Mithras House Canteen.
Canteens need a relatively low level of lumination per square meter, only 100-200 (lux). The type of lighting to be used (if not already), should 26mm fluorescent tubes or compact fluorescents (using triphosphor lamps near food areas). Perhaps also the lights should work on timing devices, or respond to motion or occupancy. Louvers and diffusers also makes the light distribute better into an indoor environment. Further still perhaps photo sensors or photocells could be fitted to lights. These work by responding accordingly to daylight intensity.
Indoor Air Quality
From assessment of the two canteens, I did not find that there was any intrusion from outside pollutants, in to the canteens, or so I noticed. All I did notice was however that there was in both busy and quiet times lingering smells of food. This could be improved possibly by added emphasis on the air changes for a dining area. The statutory regulations I found were that there should be a minimum of 18-litres/second air change rate, taking into account air movement speeds and noise problems.
Measurements show that in a household kitchen you can find more dangerous levels of pollutant than you may find on a busy street corner. As a general rule these are generated from cooking and the various fuels we use to cook with. But these harmful levels can be avoided by good ventilation.
Provide system designs and supervise installation of indoor air quality control or ventilation systems. Remind building owners/operators to inform occupants about any remediation measures that have been undertaken.
Bibliography
. A.J Metric Handbook. 1999
2. CIBSE Guide Section A. 1999
3. CIBSE Guide Section B. 1999
4. World Health Organisation. Health Aspects of the Indoor Environment: Thermal Comfort, Lighting and Noise Environment and Air Quality. 1987
5. Grehant, Beranrd. Acoustics in Buildings. 1996. (Thomas Telford)
6. Yocum, J. McCarthy, S. Measuring Indoor Air Quality, A Practical Guide. 1991. (Wiley)
7. McMullan, R. Environmental Science in Building. 5th Edition. 2002. (Palgrave)
8. http://www.innova.dk/books/thermal/thermal.htm#14
9. http://www.e-sci.com/genSci/6/1029/1066/10013.html
0. http://www.tsi.com/iaq/products/iaqcalc/iaqcalc.htm#logging
1. http://hcima.org.uk