=
That is, if you set time and distance for your x and y-axes respectively, you will be able to derive the velocity; or the acceleration for velocity and time. In this experiment, it is aimed to interpret the different motion graphs through its theoretical explanation and the actual act of doing the motion, done in the graph matching. Along with the graph interpretation is the mathematical computation of the gradients of the graphs: the velocity and the acceleration.
This experiment was done through the aid of a motion detector, which detects objects at a range of 30o and with an interface that allows the user to see a graphical representation of his motion through a monitor, in accordance to a pre-set graph of a motion that he needs to follow. The person being detected follows, as similarly as possible, the trend of motion in the default graph – hence graph matching.
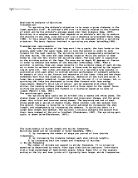
Motion Graph 1
Analysis: The motion described in this graph is a motion that starts about 0.7 meters away from the detector, and stay at rest for 2 seconds. Then at t=2, the person started moving about 1.3 meters backward at a constant velocity; the person then stayed at rest again for another 2 seconds and then started moving 0.5 meters forward at t=8. Finally, at t=8, the person stayed at rest again for another 2 seconds.
Velocity at t= 0 to t=2 , t=4 to t=6 and t=8 to t=10 is 0.
At t=2 to t=4,
=
=
=
At t=6 to t=8
(Note:The answer is negative because the person is moving towards the detector)
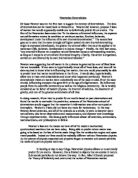
Motion Graph 2
Analysis: The motion described in this graph is a motion at increasing velocity (constant acceleration). The person started moving away 0.5 meters from the motion detector to 2.5 meters, at an increasing pace.
Computing for the person’s velocity, at t=0 to t=2
=
=
=
At t= 2 to t=4,
For the acceleration;
Motion 7 Graph
Analysis:The motion described in this graph is a motion that forms a sine or cosine curve meaning that it is periodic. In addition to that, it moves smoothly to and fro thus making it look like a wave.
Computing for the Average velocity:
Motion 8 Graph
Analysis: In this graph, the dependent is the velocity. It means that no matter where you are, whether 0.5m away from the sensor or 2.5m, the base line will always be at zero. This graph suggests no movement from t=0 to t=2, move away from t=2 to t=5, and then move to your previous position and stationary again at t=5 to t=7. After that, you should move quickly in front and then stop immediately at t=7 to t=9. To end it, we should return to your first position and then stop until the data gathering ends.