Determination of Equilibrium Constant for FeSCN2+ 4.56 --- 3.20 3.20
Determination of dissociation constant for a weak acid 3.75 3.48 3.94 ---
Effectiveness of commercial antacids 4.79 --- 3.41 3.09
Buffers 3.88 --- 4.03 ---
Determination of a solubility product constant 4.20 3.73 3.26 3.18
Examples of chemical equilibrium 4.20 --- 4.35 ---
Voltaic cells 4.66 --- 3.72 ---
Efficiency of electrochemical etching 4.00 --- 3.34 ---
Mean 4.08 3.52
Number of cases 71 80
Change in rubric scores from fall to spring .18 .39
Note: the voltaic cells experiment was not included in the totals for spring 1999 because one laboratory section did not complete the assignment.
The rubric provided the means for determining a six point holistic scale with a score of 6 indicating exemplary work. Papers that were illegible or had indecipherable words, were incoherent or made no sense, or were blank papers were recorded as non-scoreable and received a score of 0. A student who did not hand in a report received a score of 0. Every semester a second professor would independently score four sets of laboratory reports to determine the reliability of the scoring system for the laboratory reports. The two people scoring the reports would discuss those reports that did not receive the same or adjacent scores in order to agree on the scores. In general, the second scorer usually gave the lower score (see Table 1).
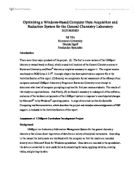
In 1998-1999 there was an increase in the rubric scores on the laboratory reports. The five students who took the first semester course in the fall of 1997 and the second semester in the spring of 1999 were included. The control groups had a mean score of 3.10 in the fall and a mean score of 3.60 in the spring (See Figure 1). The experimental groups had a mean score of 2.97 in the fall and 3.37 in the spring. The experimental method was more difficult for most students.
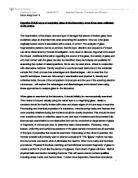
The women in the control groups had the highest rubric scores (See Figure 2). In fall the experimental women had the next highest scores, and in spring the control men had the next highest scores. All of the groups had an increase in scores from fall to spring.
Myers-Briggs Type Indicator
According to Isabel Myers and Mary McCaulley, the Myers-Briggs Type Indicator contains four indices, which reflect four preferences concerning the use of perception and judgement (. The EI scale (extraversion or introversion) concerns whether a person is focused on the outside world of other people or the inside world of ideas. The SN (sensing or intuitive) scale indicates a preference for observable events or facts that are discovered through one of the five senses as opposed to the meanings or relationships developed in one’s mind. The TF (thinking or feeling) scale describes the dichotomy between deciding based on logical consequences or deciding based on values. The JP (judgment-perception) index describes the process used in connection with the outside world. This concerns the decision to use the judging attitude by using thinking or feeling or to use the perceptive attitude using sensing or intuition (. Sixteen "types" result from the various combinations of these four preferences. Myers and McCaulley believe that the types display different motivations for learning and that it is important to develop different teaching methods, curricula, and materials for different types (.
During the 1998-1999 school year, high scores on the judging scale correlated with higher rubric scores in fall .26**†, but there was no relationship in the spring. Conversely student who had higher scores on the perceiving scale had a significant negative correlation.
Temperament Types
Myers and McCaulley found that science is often chosen by NT types in response to the question on the MBTI that asks “Which do you like best --math, English, science, history, practical skills, music, art?” This could be because science can connote actions like discovery, analysis and theory that would appeal to this (.
All of the temperament groups had an increase in rubric scores from fall to spring. The intuitive thinkers showed the greatest improvement. The sensing perceivers and the sensing judgers had the highest scores in fall, and the intuitive thinkers and the sensing perceivers had the highest scores in spring (see table 2). The scores for the intuitive feelers dropped in spring.
Table 2: Personality temperaments in chemistry laboratories
1997-98 1998-1999
Number Percent Number Percent
Intuitive thinkers (NT) 8 15.4 25 21.9
Intuitive feelers (NF) 16 30.8 23 20.2
Sensing judgers (SJ) 22 42.3 40 35.1
Sensing perceivers (SP) 6 11.5 26 22.8
Missing 85 21
Total 137 135
Table 3: Rubric scores by school year for experimental and control groups
Fall semester Number Spring semester Number Change
1997-1998
Control 3.87 60 4.01 45 .14
Experimental 3.97 26 4.18 26 .21
1998-1999
Control 3.10 75 3.60 52 .50
Experimental 2.97 40 3.37 28 .40
Table 4: Rubric scores by school year for experimental and control groups
by semester
1997-1998 Fall semester Spring semester Change Number
Control both semesters 4.27 4.08 -.19 27
Control fall, experimental spring 3.59 3.90 .31 11
Experimental fall, control spring 4.06 4.10 .04 8
Experimental both semesters 4.43 4.62 .19 9
Control fall, no spring semester 3.52 22
Experimental fall, no spring 3.44 9
Control spring, unknown fall 3.76 10
Experimental spring, unknown fall 4.04 6
Total 3.90 (n=86) 4.08 (n=71)
1998-1999 Fall semester Spring semester Change Number
Control both semesters 3.87 3.70 -.18 29
Control fall, experimental spring 4.20 4.16 -.04 12
Experimental fall, control spring 3.45 3.53 .08 10
Experimental both semesters 3.43 3.08 -.35 10
Control fall, no spring semester 2.05 34
Experimental fall, no spring 2.50 20
Control spring, unknown fall 3.43 13
Experimental spring, unknown fall 3.05 6
Total 3.05 (n=115) 3.51(n=80)
Note: The tables on this page include the scores of five people who took the fall semester in 1997 and the spring semester in 1999 in the 1998-1999 data.
For the 1997-1998 school year the experimental group had slightly higher rubric scores than the control group in both the spring and the fall. Both groups appeared to have improved slightly from fall to spring. In the 1998-1999 school year both groups had lower scores in fall and spring than the previous year. Both groups again appeared to improve, and the first year the experimental groups had a slight larger increase in scores and the second year the control group had a slightly larger increase. (See Table 3.)
To examine the differences that the experience of being in the experimental and control groups made, eight groups were developed for the 1997-1998 school year. The students could be in the control group both semesters, the control group in fall and the experimental group in spring, the experimental group in fall and the control group in spring, or the experimental group both semesters. Some students did not take the course both semesters so four additional groups were constructed. These were students who were in only the control and experimental groups in fall, or only in the control and experimental groups in spring. Because of the large number of groups and the small number of students, these data should be considered to be preliminary or pilot data. (See Table 4.)
For the 1997-1998 school year, the students in the experimental sections for both semesters had slightly higher rubric scores than the others. The mean rubric scores for the students who were in the control group both semesters declined slightly, while the scores for the students in the other sections increased slightly. The largest increase was for the students who were in the control sections in fall and the experimental sections in spring. About 37% of the control group students dropped the course in spring, and about 35% of the experimental group students dropped the course. The control group students who dropped the course had a mean rubric score of 3.5, and the experimental students who dropped had a mean rubric score of 3.4.
For the 1998-1999 school year, the fall control groups had higher rubric scores than the experimental groups. Fewer students took the second semester laboratory course both years. The students who were in the control group both semesters had above average scores, but the scores declined slightly in the second semester. The students in the control group in fall and the experimental group in spring started out with the highest rubric scores and declined very slightly. This may reflect a regression to the mean effect. The students in the experimental group in fall and in spring had lower scores than any of the control groups, but they increased their scores slightly in spring. The students who had two semesters in the experimental section had the lowest scores in fall and had even lower scores in spring.
What contributed to what looked like an overall rise in spring rubric scores are students who dropped the course. In fall, 34 (45.3%) of the students from the control groups who had an average 2.05 rubric score and 20 (50.0%) of the students from the experimental group who had an average 2.50 rubric score dropped the course. The 13 students who entered the course without data from the year before had an average 3.43 rubric score in spring, and the 6 experimental students had an average 3.05 rubric score. These scores were higher than the scores that the fall students who dropped the course had in fall.
Another issue is how the control group did in comparison to the experimental group in the other grading areas. The control group did slightly better in the lab grades, tests, the final exam and the final grade.
Chemical Background Information
On the Kutztown University Chemical Background Information Questionnaire (Appendix A), the questions explored the science courses that the students completed in biology, chemistry, and physics in high school and the grades that they received
Most of the students had taken science courses in high school, and 93.6% in 1997 and 94.6% in 1998 of the students who filled out the questionnaire said that they had taken chemistry in high school. In 1997 about 22.5% had received a grade of A, and 55.0% had received a B. The mean was 2.96 in 1997 and 3.11 in 1998. About 34% had received a grade of A in 1998, and 44% had received a B. Nearly 40% of the students had completed extra projects in science in high school. Having earned a higher grade in physics in high school correlated significantly .39* with the rubric score in the first semester. There were 66 students who had taken physics in high school in fall. In spring when only 43 had had physics in high school, there was no significant correlation. The other individual courses including chemistry and the total number of science courses that they took did not correlate with the rubric scores that they earned.
Table 5: Grades for science courses students took in high school
Course % took % had lab % A % B % C % D Mean
1997-1998
Biology 99.0 85.7 38.8 48.2 12.9 --- 3.26
Chemistry 93.6 94.5 22.5 55.0 18.8 3.8 2.96
Physics 73.4 78.3 23.8 46.0 22.2 7.9 2.86
Other science 82.3 73.1 54.2 33.9 11.9 --- 3.42
1998-1999
Biology 99.1 92.2 33.0 57.5 9.4 --- 3.24
Chemistry 94.6 93.1 34.0 44.0 21.0 1.0 3.11
Physics 68.5 84.8 30.4 39.1 24.6 5.8 2.94
Other science 79.3 67.9 48.3 43.1 8.6 --- 3.40
The questionnaire explored the mathematics course that the students completed in high school and the grades that they received. In 1997 the students reported taking from one to six courses in mathematics and the average was 3.9. In 1998 the students said that they had taken from one to seven mathematics courses in high school. The average was 3.8 courses.
There was a .49* correlation with the calculus grade in high school and the spring rubric score, but this analysis involved only 23 students. The other individual mathematics courses, the individual grades, the total number of mathematics courses, and the total grades did not correlate with the rubric scores.
Table 6: Grades for mathematics courses students took in high school
Course % took % A % B % C % D % F Mean
1997-98
Algebra I 98.9 46.3 40.3 13.4 --- --- 3.33
Algebra II 87.1 39.1 43.8 17.2 --- --- 3.21
Geometry 89.2 32.3 48.4 17.7 1.6 --- 3.10
Trigonometry 63.4 26.7 44.4 26.7 --- 2.2 2.93
Calculus 20.7 40.0 26.7 20.0 6.7 6.7 2.87
1998-99
Algebra I 92.9 43.4 43.4 10.5 2.6 --- 3.28
Algebra II 79.6 39.7 33.8 25.0 1.5 --- 3.12
Geometry 84.1 33.8 44.2 20.8 1.3 --- 3.10
Trigonometry 54.9 33.3 51.0 11.8 2.0 2.0 3.12
Calculus 34.5 26.5 38.2 29.4 5.9 --- 2.85
Computer skills in word processing were often reported, but less than two thirds of the students had skills in using databases or spreadsheets. During the 1998-99 school year there was a -.22* correlation with having used a database before the laboratory sessions began and the fall rubric score and a -.29** correlation with having used a spreadsheet and the fall rubrics score. There was no relationship with the spring rubric scores. There was also a -.26* correlation with having used a drawing program and the fall rubric score. It appears that having prior computer experience was not helpful. The feeling of comfort in using the computer did not correlate with the rubric scores. Having a higher interest in computers correlated .25* with the rubric scores in the spring semester. There was no correlation with employment or hours of employment.
Table 7: Computer skills
1997-98 1998-99
Percent Percent
I know how to use:
a word processing program 90.4 90.8
a database 46.5 58.0
a spreadsheet 69.0 67.3
a drawing program 37.3 58.7
Windows 95 81.1 84.0
I have my own computer 52.7 63.0
I have taken computer courses 63.7 61.7
Using the computer I feel
very comfortable 7.3 6.2
somewhat comfortable 18.8 18.6
somewhat uncomfortable 62.5 46.0
very uncomfortable 11.5 29.2
Mean 2.8 3.0
Interest areas on a scale of 1-10 Mean Mean
My interest in science is 8.9 8.7
My interest in chemistry is 6.8 6.6
My interest in science laboratories is 7.5 7.3
My interest in computers is 6.2 6.5
Employment
I am employed 60.6% 55.9%
Hours per week that I am currently employed 10.5 11.0
Credit hours a week that I am currently taking 15.3 14.9
Scientific Curiosity
In general during the 1998-1999 school year, both male and female students indicated more curiosity in the biology questions than in the chemistry questions. Many of these students indicated that they want to major in biology. They also indicated a greater willingness to be more actively involved in searching for answers in the biology group than the chemistry group. Men had more interest than women in the chemistry questions, and women had more interest than men in the biology questions. The women indicated a greater willingness to search for answers to the biology questions, and men had more interest in searching for answers to the chemistry questions. There was a significant negative correlation between high rubric scores and high curiosity to the biology questions.
Table 8: Scientific curiosity inventory
1997-98 1998-99
Have you ever wondered?
a. How plastic are made? 67.4 68.5
b. What atoms and molecules are? 71.6 70.3
c. Why some things burn and others do not? 85.3 82.0
1. I would be interested in hearing about the unusual application of one of these topics. 92.6 90.0
2. I would look for the answer to one of these questions. 35.8 37.6
3. I enjoy studying about topics like these. 67.0 70.9
4. I am interested in doing research to answer questions like these. 43.2 50.9
5. My desire to know the answers to questions like these is important to me 46.7 48.2
6. I would watch a television program about a topic like this. 78.9 82.9
Have you ever wondered?
d. Why you look like your parents? 68.8 77.3
e. How birds know to fly south in the winter? 74.2 88.3
f. How prescription drugs help the body fight disease? 87.1 90.1
7. I am intrigued by what causes such things to occur. 86.3 92.8
8. I would watch a program which provided me with information and 83.2 90.1
explanations about these topics.
9. I enjoy doing experiments to discover the answers to such questions. 81.1 81.1
10. The practice of exploring ideas about such topic is important to me. 70.2 71.2
11. I must get the answers to questions like these. 41.1 41.4
Have you ever wondered?
g. How fish breath under water? 84.0 81.1
h. What causes allergies? 81.1 83.8
I. Why trees shed their leaves in the fall? 72.3 73.0
12. I am interested to find out about one of these topics. 88.4 87.3
13. I would read a book, newspaper article, or magazine article to find 85.3 86.5
out about the above topics.
14. I enjoy participating in a good discussion about such topics. 80.2 76.6
15. After watching a program about such topics, I generally discuss the ideas 46.9 59.5
of the program with my friends.
16. I have embarked on extensive reading programs to satisfy my curiosity 19.8 26.1
about science topics like these.
17. I like to read articles to satisfy my curiosity about science topics like these. 77.2 69.4
Have you ever wondered?
j. Why do metals corrode? 53.2 62.2
k. How does a neon sign work? 68.4 68.5
l. Why are some radioactive materials more dangerous than others? 68.1 66.7
18. I would like to find out about one of these questions. 78.1 82.9
19. I would have several questions to ask about these topics. 60.4 58.6
20. I enjoy finding answers to questions like these. 65.6 72.7
21. I seek out friends who share an interest in finding out about questions like these. 35.4 18.9
22. I am willing to engage in an extensive plan of investigation 35.4 33.6
to discover answers to questions like these.
23. I am not satisfied with vague explanations about such questions. 60.4 66.7
Table 9: Scientific curiosity scores by gender in 1998-1999
Males Females Total
First chemistry wonder set (3 items) 2.28 2.17 2.22
Second chemistry wonder set (3 items) 2.15 1.85 1.99
Total chemistry wonder set (6 items) 4.42 4.05 4.22
First chemistry discovery set (6 items) 3.85 3.54 3.69
Second chemistry discovery set (6 items) 3.43 3.22 3.32
Total chemistry discovery set (12 items) 7.25 6.75 6.99
First biology wonder set (3 items) 2.25 2.52 2.40
Second biology wonder set (3 items) 2.33 2.44 2.39
Total biology wonder set (6 items) 4.57 4.95 4.77
First biology discovery set (5 items) 3.51 3.95 3.74
Second biology discovery set (6 items) 3.90 4.20 4.06
Total biology discovery set (11 items) 7.39 8.15 7.80
Scholastic Aptitude Test scores
In the 1997-1998 school year, 106 had SAT scores, and in the 1998-99 school year, 107 had SAT scores. The means for the mathematics scores were slightly higher than the means for the verbal scores. There was no correlation between the 1997-98 or the 1998-99 SAT scores and the rubric scores.
Table 10: Mathematics and Verbal Scholastic Aptitude Test scores
1997-98 1998-99
Mathematics SAT scores total 491 512
Verbal SAT scores 478 513
Class Rank
Students who were in the top of their class in high school had higher rubric scores. In the 1998-1999 school years there was a .45** correlation between class rank and fall rubric scores and a 27* correlation between class rank and spring rubric scores. There was a correlation of .64** with the grade point average and their rubric scores in fall and a correlation of .68** in spring.
Table 11: Rubric scores by quartile class rank
Fall Rubric Spring Rubric Change in Scores
Average Number Average Number Average Number
First quarter 4.04 26 3.93 26 -.18 19
Second quarter 2.99 34 3.44 23 -.25 15
Third quarter 2.57 33 3.35 15 -.19 11
Fourth quarter 2.80 4 2.61 4 -.77 2
Anecdotal Suggestions
Most faculty agree that the majority of our students respond more positively to the Control treatment than the Experimental treatment. Students’ reactions seems to divide them into three groups: (1) motivated students with average ability in chemistry; (2) students with high ability in chemistry; and (3) others.
(1) Many motivated students have difficulty or get frustrated while trying to apply theory to laboratory situations where prompting is not provided, so they have difficulty with the Experimental treatment. When given correct solutions in Excel Control treatment spreadsheets, these students thrived. They studied the Excel equations, worked to understand them, rewrote them in standard algebraic form, and prepared excellent Data Analysis sections in their laboratory reports. Since this is a large cohort of students that we wish to support and encourage, our standard approach will probably be similar to the Control treatment, although we will keep the Experimental templates available on our servers for sections that seem to respond to them.
(2) A small cadre of very good students (often only one or two students in a laboratory section of 20, or perhaps 10% of the class in general) did appreciate the "eureka" experience that the Experimental treatment afforded them. Conversely, they occasionally reported that the Control treatment was not challenging enough, or that they feared it might not provide enough of a preparation for anticipated future challenges. Because our templates are open-ended and Excel is so powerful, these students can be challenged with suggestions for additional data treatment or exploration, on the relatively rare occasions where this seems appropriate, even when Control templates are used.
(3) Since chemistry is a required course in many curricula and the subject is difficult for students, a large number of them are unmotivated and almost resentful of having to exert effort in the course. While these students often were much more positive about either the Experimental or Control treatment than they were about other approaches they had experienced in chemistry laboratories, they also did not seem to show growth as a result of either treatment. Ironically, many of these students seemed enthusiastic about learning the Excel technology while faculty helped them enter formulas into the Experimental templates. But the enthusiasm did not seem to spread to learning the underlying chemistry. Since some success could be had with less effort under the Control treatment, it was apparently both preferred by, and more effective for this group of students.
Conclusion:
The rubric scoring of laboratory reports can provide a consistent means of assessment that can show student growth in writing laboratory reports over time. It is important to track the scores for individual students in addition to the class average. Class averages may be misleading due to low scores for students who drop the course as this report demonstrates.
For this project laboratory reports were graded using a holistic score from six to one. Some of the professors thought that a domain scoring guide, which would provide a score on each of the sections, would be more helpful to students. For example, a student who received four separate scores of 6, 6, 6, 2 on a domain rubric can focus on improving the section scored 2, while if only a holistic score of 5 were reported, the student might incorrectly conclude that all sections were close to the maximum. The holistic score was used in part to reduce the grading burden on thirteen or fourteen laboratory reports for each student, but a domain scoring might be more beneficial to student improvement. Other techniques might prove helpful to improving the reports. One would be to have peers review the laboratory reports using the rubric, and then the students could revise their reports before they are graded. Another technique would be to allow the students to revise the reports for consideration for a higher grade after revision. The experimental method was more difficult for most students in this sample, although given the small number of students, this is a tentative result. Class rank has a strong relationship with students’ ability to write laboratory reports, but there is no correlation with SAT scores. There is a small negative correlation with some prior computer experience with databases and spreadsheets. There seems to be a relationship with a student's temperament scores and their ability to write better laboratory reports. These should be regarded as pilot data, and should be examined in a larger study with more students to determine if there are other teaching methods which can improve the performance of students with various characteristics.
Bibliography
1. Campbell, J. R. Cognitive and Affective Process Development and its Relation to a Teacher’s Interaction Ratio. Journal of Research in Science Teaching. 8, 317-323 (1971). Return
2. Johnstone, A.H., Journal of Chemical Education. 70, 701-5 (1993).
3. Myers, Isabel Briggs and McCaulley, Mary H. Manual: A Guide to the Development and Use of the Myers-Briggs Type Indicator. Palo Alto, Ca: Consulting Psychologists Press, Inc. 1985.
4. Vitz, Ed. Journal of Chemical Education. 75, 1661 (1998).
5. Vitz, Ed. LIMSport: Computer Data Acquisition and Reduction for the General Chemistry Laboratory. Kutztown University: Department of Physical Sciences. 1997.
Appendix A: Kutztown University
Chemical Laboratory Background Information
Name Age
Proposed major
Career goal
Year graduated from high school
Number of college courses completed
Science courses completed in high school
Biology Yes No Grade Received
Course Title
Laboratory Yes No
Chemistry Yes No Grade Received
Course Title
Laboratory Yes No
Physics Yes No Grade Received
Course Title
Laboratory Yes No
Other science courses Yes No Grade Received
Course Title
Laboratory Yes No
I have done extra projects in science in high school. Yes No
Mathematics courses completed in high school
Course Title Grade
Course Title Grade
Course Title Grade
Course Title Grade
Course Title Grade
Science courses completed in college
Course Title Grade
Laboratory Yes No
Course Title Grade
Laboratory Yes No
Mathematics courses completed in college
Course Title Grade
Course Title Grade
Computer skills
I know how to use:
a word processing program Yes No
a data base Yes No
a spread sheet Yes No
a drawing program Yes No
Windows 95 Yes No
I have my own computer Yes No
I have taken computer courses Yes No
Using the computer I feel
very comfortable somewhat comfortable
somewhat uncomfortable very uncomfortable
Interest in science and chemistry
On a scale from 1 to 10 with a one representing no interest and a ten representing extreme interest, I would say my interest in science is .
On a scale from 1 to 10 with a one representing no interest and a ten representing extreme interest, I would say my interest in chemistry is .
On a scale from 1 to 10 with a one representing no interest and a ten representing extreme interest, I would say my interest in science
laboratories is .
On a scale from 1 to 10 with a one representing no interest and a ten
representing extreme interest, I would say my interest in computers is .
Time commitments
I am employed ___ Yes ___ No
I am currently employed ___ hours a week.
I am taking ___ credit hours a week.
Appendix B: Scientific Curiosity Inventory
This survey is an inventory which will attempt to measure what you will do to satisfy your scientific curiosity. For each question check the appropriate answer. If you have doubts about your answer check the “No” response. Do not become concerned about the number of “No” answers you select, simply try to be as honest and frank as possible.
Yes No
Set 1
Have you ever wondered:
a. How plastics are made? _____ _____
b. What atoms and molecules are? _____ _____
c. Why some things burn and others do not? _____ _____
For questions a, b, or c:
1. I would be interested in hearing about the unusual
application of one of these topics. _____ _____
2. I would, on my own, look for the answer to one of these questions. _____ _____
3. I enjoy studying about topics like these. _____ _____
4. I am interested in doing research to answer questions
like these. _____ _____
5. My desire to know the answers to questions like these is important to me. _____ _____
6. I would watch a television program about a topic like this. _____ _____
Yes No
Set 2
Have you ever wondered:
d. Why you look like your parents? _____ _____
e. How birds know to fly south in the winter? _____ _____
f. How prescription drugs help the
body fight disease? _____ _____
For questions d, e, or f:
8. I am intrigued by what causes such things to occur. _____ _____
9. I would voluntarily watch a program which provided me
with information and explanations about these topics. _____ _____
10. I enjoy doing experiments to discover the answers to
such questions. _____ _____
11. The practice of exploring ideas about such topics is important to me. _____ _____
12. I must get the answers to questions like these. _____ _____
Yes No
Set 3
Have you ever wondered:
g. How fish breathe under water? _____ _____
h. What causes allergies? _____ _____
I. Why trees shed their leaves in the fall? _____ _____
For questions g, h, or i:
13. I am interested to find out about one of these topics. _____ _____
14. I would read a book, newspaper article, or magazine
article to find out about the above topics. _____ _____
15. I enjoy participating in a good discussion about such topics. _____ _____
16. After watching a program about such topics, I generally
discuss the ideas of the program with my friends. _____ _____
17. I have embarked on extensive reading programs to satisfy
my curiosity about science topics like these. _____ _____
18. I like to read articles to satisfy my curiosity about science topics like these. _____ _____
Yes No
Set 4
Have you ever wondered:
j. Why do metal corrode? _____ _____
k. How does a neon sign work? _____ _____
l. Why are some radioactive materials more
dangerous than others? _____ _____
For questions j, k, or l
19. I would like to find out about one of these questions. _____ _____
20. I would have several questions to ask about these topics. _____ _____
21. I enjoy finding answers to questions like these. _____ _____
22. I seek out friends who share an interest in finding out about questions like these. _____ _____
23. I am willing to engage in an extensive plan of investigation
to discover answers to questions like these. _____ _____
- I am not satisfied with vague explanations about such
questions. _____ _____
Appendix C: Informed Consent Form-
- Optimizing a Windows-Based Computer Data Acquisition
- and Reduction System for the General Chemistry Laboratory
- Dear Student,
- We are conducting a study to determine the best way to teach General Chemistry laboratories.
- The study is part of a project funded by the National Science Foundation (NSF/DUE 9652855). In this study you will be asked to complete the Myers-Briggs Type Indicator survey, and a Background Survey. The rest of the study involves your participation in a standard laboratory program, which is a required part of General Chemistry. Your participation for the optional surveys should take less than an hour.
- There are no additional risks or costs to you. The study will involve trying various different ways to conduct experiments in our nationally-recognized, computerized General Chemistry laboratory. None of the laboratory work will be any more difficult or time consuming than is typically the case for General Chemistry, but you will have the opportunity to work in a truly state-of-the-art laboratory which has been described in a series of articles in international journals. The National Science Foundation (NSF) has also funded a series of workshops where college professors from about 40 of the states have visited our laboratory for a week during the summer to study our approach. Now the NSF has funded a project to develop a Windows-based laboratory system which is the best possible for General Chemistry students.
- All information from our surveys will be handled in a strictly confidential manner, so that no one will be able to identify you when the results are reported. The database will be maintained by an outside consultant on a secure computer.
- Your participation in this study is totally voluntary and you may withdraw at any time without negative consequences. If you wish to withdraw simply contact Dr. Ed Vitz (Extension 4443 or email [email protected]).
- Feel free to contact the Principal Investigator of the project, Dr. Ed Vitz, at the phone number above if you have any questions about the study at any time.
- I understand the study described above and have been given a copy of the description as outlined above. I am 18 years of age or older and I agree to participate.
- ________________________________
- Signature of Participant / date
Appendix D: Kutztown University Chemical Laboratory Assessment
Rubrics for Laboratory Assignments
Non-Scoreable (NS)
∙ Is illegible or has indecipherable words
∙ Is incoherent or makes no sense
∙ Is a blank paper
Characteristics of a Complete Laboratory Report
This rubric was developed during a series of 6 departmental meetings (during Spring 1997) devoted to that purpose with an assessment consultant, Brenda Egolf, from the Office of Social Research at Lehigh University.
- Appendix E:
- About the Myers-Briggs Type Indicator
- You may be wondering why the Myers-Briggs Type Indicator (“MBTI”), a kind of personality survey, is being administered in General Chemistry.
- Our goal is to improve the General Chemistry Laboratory experience for all students, and we’ve received National Science Foundation funding to do so. We realized right away that an “improvement” for one person may not be an improvement for another, so we looked for a reliable way of determining what preferences students are likely to have. Surveys designed for this purpose are called “type indicators,” and we hope that the Myers-Briggs Type Indicator that we chose will help us to see which approaches to the laboratory program are most successful or enjoyable for which personality “types.” We hope that many of the most successful approaches will be included in the final version of the General Chemistry laboratory program at Kutztown University.
- The MBTI is a well-established survey that indicates personality features which may impact on learning. We’ll offer you the opportunity to complete the survey, and you may choose to attend one of several optional evening sessions where we will provide you with information on the results and what they mean. The MBTI will be completely confidential. None of the instructors will see your survey results, which will be tabulated by an outside consultant. Only the outside testing consultant will be able to associate a score with your name, and the files will be confidential. The scores will help us to understand, in general, who we’re helping with various course improvements.
-
We believe that the MBTI may also be interesting to you personally for several reasons, so you could view it as a real “bonus.” The Myers-Briggs test is used in career planning, in marital counseling, in self-help or personal development, and in teamwork development in many businesses. A book about the MBTI, “Introduction to Type® in College,” by John K. Di Tiberio and Allen L. Hammer, will be placed on reserve for you to read at the library. The summary claims that the book might help you...
- “Survive college by applying MBTI type concepts to improve study techniques and resolve roommate conflicts High school and college students can prepare for the rigorous academic and social aspects of university life with “Introduction to Type in College.” This 32-page booklet describes how a student's MBTI type can affect learning styles, study habits, test taking, roommate and personal relationships, and stress in the college environment. It explains all 16 MBTI types and gives suggestions to overcome typical college environment problems using easy language and entertaining cartoons from "Calvin and Hobbes" and "The Far Side."
-
The Consulting Psychologists Press, publishers of the MBTI, maintain a Web page that is mostly commercial, but may have some interesting information for you. It includes a “Personal Development page,” hyperlinks to “Other Career Information on the Web,” and information about books about personal growth, career exploration, and analyzing personality dynamics to strengthen relationships. The URL is
-
† throughout this document, ** indicates correlations with P=0.01 and * indicates correlations with P = 0.05