pH Effect on Enzymes:
Enzymes are said to be sensitive to changes in pH due to their active sites being very sensitive. Enzymes work best at the optimum pH but can become denatured if the reaction becomes too acidic or alkaline (Barber et al. 1997).
Materials:
The materials used during this experiment included:
- Plastic Gloves
- Auto – Pipettes
- Beakers
- Cuvettes
- Test Tubes
-
Water Baths (set at 40oC, 50oC, 60oC and 100oC)
- Spectrophotometers
- Fructose Solution (ml)
- Distilled Water (ml)
- Acetate Buffer (ml)
- DNS Reagent (ml)
- Sucrose (ml)
- Intervase Solution (ml)
- Acetic Acid (o.2 M )
- Stop Clock
- Lab Coat
Method:
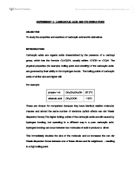
Effect of Substrate Concentration on Intervase Activity:
-
A series of sucrose dilutions was prepared from the stock sucrose solution. Table 1 shows the dilutions prepared for each test tube:
Table 1
- 1ml of acetate buffer (ml) was added to each test tube using a pipette.
-
Afterwards each test tube was shaken thoroughly and then equilibrated in a water bath at 40oC for at least 5 minutes.
- Whilst the tubes were in the water bath, 0.05ml of intervase solution was pipette into each test tube at 30 second intervals. These also had to be shaken regularly since the sucrose solutions are fairly viscous.
- After 10 minutes the reaction in each test tube was stopped and 2ml of DNS reagent was added to each test tube at 30 second intervals using a pipette. The same order had to be done as when the intervase was added to each test tube.
- The tubes were then placed in a boiling water bath for at least 20 minutes; colour change was also noted before taking the tubes out.
- After the tubes cooled, 20ml of water was added to each tube and mixed thoroughly.
- Finally the absorbance was measured for each tube at 540nm.
An Investigation into the Effect of pH on the Activity of Intervase:
- 10 test tubes were labelled, and then 2ml of distilled water was added to Tube 1. Additionally 2ml of sucrose solution was added to Tubes 2-10. Finally 1ml of acetate buffer was added to each tube.
-
Each tube was then shaken thoroughly and allowed to equilibrate in a water bath at 40oC for at least 5 minutes.
- 0.05ml of intervase solution was pipette into each tube. The tubes were then shaken thoroughly again and remained in the water bath at all times.
- The reaction in each tube was stopped after 10 minutes by adding 2ml of DNS reagent.
- The tubes were then placed in boiling water for at least 20 minutes (any colour change that took place was recorded).
- The tubes were allowed to cool.
- The absorbance for each tube was then measured at 540nm.
An Investigation into the Effect of Temperature on the Activity of Intervase:
Same method was used as for the ‘Effect of Substrate Concentration on Intervase Activity’. This method was also repeated several times using a whole range of temperatures from 40oC – 800C.
Results:
Appendix A is a graph showing the substrate concentration against the absorbance. Before doing this graph the substrate concentration needed to be calculated, the formula:
Conc. = 1.8 x volume sucrose = M 3.05
1.8 is used since that is the number of moles for the stock solution and 3.05 was the total volume of the reaction mixture. For example to work out the substrate concentration for Tube 1, the value 0.05 was used since that was the volume of sucrose used for that tube:
Conc. = 1.8 x 0.05 = 1.8 x 0.016 = 0.028 3.05
The results showed that as the substrate concentration increased so did the rate at which the intervase enzyme was being absorbed. Also the colour changed to a bright orange colour.
The graph on the effect of pH on intervase can be seen in appendix B. Here the graph didn’t come out as well as it should have and this will be discussed further in discussion. But it shows that the optimum pH was pH4, this is where the enzyme worked at its best.
The graph on the effect of temperature on intervase can be seen in appendix C. It can be seen that the optimum temperature where the enzymes reacted the most was at 60oC, and the least was found to be at 40oC.
The Raw Data for this experiment can be seen in Appendix D.
Discussion:
Effect of Substrate Concentration on Intervase Activity:
From the results it can be seen that an increase in substrate concentration caused an increase in the absorption of the enzyme. Reaching its maximum peak of 0.163nm, this is due to the fact that as the substrate concentration increases this means that there are more active sites available on the enzyme to act upon. This causes the reaction to go faster and faster with the kinetic energy increasing and the molecules colliding more with each other.
An Investigation into the Effect of pH on the Activity of Intervase:
From the results it can be seen that the optimum pH reached was pH4, this meant that the enzyme reacted best at this slightly acidic side. Although since the graph on appendix B doesn’t really show an expected ‘dome shaped’ graph it could be said that a few things may have gone wrong in the experiment. This could’ve happened due to several factors such as not measuring the right amount of sucrose solutions to put into each test tube. Also contamination of the auto - pipettes was a problem during the experiment; this may have caused unnecessary chemicals coming into contact with the test tubes. Ways to prevent this from happening again would be to make sure the pipettes are held correctly in the upright position.
An Investigation into the Effect of Temperature on the Activity of Intervase:
The graph for this experiment (which can be seen on appendix C) shows how different temperatures can affect the activity of intervase. Already it can be seen that the optimum temperature was 60oC, this is where the highest level of activity with the intervase was taking place. But as we go to Tube 5 it, the level of absorbency decreases rapidly and here the enzyme is said to be denatured. The enzyme molecule seems to have been destroyed since by the time it goes to Tube 9 hardly anything is being absorbed. This shows that the reaction has also ceasing to continue. Least activity seems to have taken place at 40oC, this could be due to the fact that the enzymes are vibrating at a slower pace and less kinetic energy is involved as well then in the 60oC environment.
References:
Barber, M., Boyle, M., Cassidy, M. and Senior, K. (1997) Biology (1st edition) Collins Educational, London
Lazonby, J., Pilling, G. and Waddington, D. (2000) Chemical Ideas (2nd edition) Heinemann Education Publishers, Oxford
Lazonby, J., Pilling, G. and Waddington, D. (2000) Chemical Storylines (2nd edition) Heinemann Education Publishers, Oxford