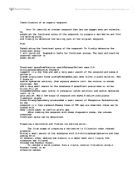
Two graphs were then made for each of the two experiments. The y-axis of the graph was the temperature recordings and the y-axis was the time in 30-second intervals. Two straight lines were then drawn on each of the graphs from the initial temperature to coldest temperature observed and straight across the 5 constant temperature recordings. The point at which these lines intersected was recorded as the freezing points of the pure solvent and the solution.
In the second part of this laboratory a glass bowl was filled with distilled water and dialysis tubing was placed in it for 30 minutes. After 30 minutes, the dialysis tubing was taken out of the water and the water was discarded. At one end of the dialysis tubing a small rubber band was wrapped around it to ensure a tight seal. The dialysis tubing was then was then filled to ⅓ capacity with clear Karo® syrup, with the assistance of a small funnel. The open end of the dialysis tubing was then closed tightly using a small rubber band, as was previously done with the other end. The dialysis tubing was then placed in a bowl and the bowl was filled up with distilled water. An effort was made to ensure that the dialysis tubing was completely submerged in the distilled water. Observations of the dialysis tubing were made every hour for a total of 5 hours and recorded.
Following the dialysis tube observation, a raw egg placed in a pint jar. Observations of the egg were then made and recorded. White vinegar was then poured over the egg until it was completely submerged. The jar was then sealed and the egg was observed after 12 and 24 hours had passed and the observations were recorded. The egg was then removed after 24 hours and placed in another pint jar and submerged in Karo® syrup. The lid was then placed on the jar and an observation was made and recorded. Observations of the egg were then made after 12 hours and 24 hours had passed and the observations were recorded. After 24 hours had passed, the egg was removed from the syrup and rinsed with tap water and observations were made and recorded.
Data Tables and Graphs:
Temperature of Distilled Water
Part 1.
Temperature of Salt Water Solution
Part 2.
Osmosis Observations of Syrup Filled Dialysis Tubing
0 Hours 1 Hour 2 Hours 3 Hours 4 Hours 5 Hours
Observations of Raw Egg
Eggshell in vinegar reaction
CaCO3+ 2H+ -> Ca+2+ H2O +CO2
Observations: _ In the second part of this laboratory, osmosis caused the syrup in the dialysis bag to enter the water and water to enter the dialysis bag until they were at equilibrium. I do not think that
an equilibrium was reached because the osmotic pressure
caused the rubber band to come off the end of the dialysis
tubing.
With the raw egg experiments, I believe that a certain element
In the eggshell must have bonded with another element in
vinegar and left in the form of the bubbles. This is what
probably caused the shell to disappear. The vinegar was also
hypotonic to the egg clearly making the egg larger. The syrup
solution was hypertonic to the egg making the egg smaller.
Questions: A. To what biological structure is the dialysis bag comparable? How is it similar? How is it different?
- The dialysis bag is similar to the cell wall of a cell. It is similar in that it allows water in and out in order to achieve equilibrium through osmosis. It is different because a cell also allows things in through active and passive transport. The dialysis tubing only allows things in and out based on the size of the
permeations in the dialysis tubing.
B. In biological systems if a cell is placed into a salt solution in
which the salt concentration in the solution is lower than in the
cell, the solution is said to be hypotonic. Water will move from
the solution into the cell, causing lysis of the cell. In other
words, the cell will expand to the point where it bursts. On the
other hand, if a cell is placed into a salt solution in which the
salt concentration in the solution is higher than in the cell, the
solution is said to be hypertonic. In this case, water will move
from the cell into the solution, causing cellular death through
crenation or cellular shrinkage. In your experiment is the
Karo® hypertonic or hypotonic to the egg?
- The Karo® is hypertonic to the egg. This is clear
because the egg shrunk in size.
C. At 23.6 C, 0.500 L of a solution containing 0.302 grams of an antibiotic has an osmotic pressure of 8.34 mmHg. What is
the molecular mass?
-
8.34 mmHg x 1 atm = 0.01097 atm
760 mmHg
0.01097 atm = M(0.0821) (273 + 23.6)
0.01097 atm = M(0.0821) ( 296.6)
-4
M= 0.01097 _ = 4.5 x 10
( 0.0821)(296.6)
Molarity = moles
L
-4
4.5 x 10 = moles
0.5
-4
= 2.25 x 10 moles
0.302 grams = 1342.2 grams/moles
-4
2.25x10
Conclusion: In the fist part of this lab, the results surprised me. I had
thought prior to completing the experiment that the salt
water solution would have lower freezing point than the
distilled water. It was also surprising that the rubber band
came undone from the end of the dialysis tubing. The osmotic
pressure must have been extremely high. I was also fascinated
to see the eggshell dissolve in the vinegar. I did not expect
that to happen, even though the lab manual said it would. Vinegar contains acetic acid, which breaks apart the solid calcium carbonate crystals that make up the eggshell into their calcium and carbonate parts. The calcium ions float free, while the carbonate goes to make carbon dioxide. The bubbles that I
observed was actually carbon dioxide floating away. I had
expected the egg to enlarge when placed in the vinegar and I
had expected it to shrink when I placed it into the syrup. I thought that I had a decent understanding of what would be
hypotonic and what would be hypertonic, until the end of the
experiment. I thought that when I rinsed the egg off, that it would increase in size again. Frankly, it may have if I submerged it in the tap water for a prolonged period of time.
All in all I believe that this was a successful laboratory. I gained a better understanding of colligative properties and
also how osmosis works.