Forensic Chemistry - Ion Selective Electrode. The objective of experiment is to determine the chloride and nitrate (toxic anions) in samples from the calibration curve
SINGAPORE POLYTECHNIC SCHOOL OF CHEMICAL LIFE SCIENCES Diploma of Applied Chemistry with Pharmaceutical Science Experiment No. 3 Metal Toxicity Module Code (CP 4098) Desmond Seah (P1006812) Year of Study: Year 2 DACP/FT Lecturer Jeffrey Whey AY 11/12 ________________ Content Page Synopsis Page . Introduction 1-2 2. Theory 2-12 3. Procedure 12-13 4. Results and calculation 13-14 5. Discussion 14-24 6. Conclusion 24 References List of Illustration S/N Figures and Tables Page Number Types of electrode with diagram 7 2 Internal structure of Ion selective electrode 8 3 Possible interferences with reference solutions stated 9 4 Calibration curve of Ion
Pembrokeshire Geology Field Trip Report. The Caerfai shale has a red/pink colour due to the presence of oxidised iron
Pembrokeshire Geology Field Trip CAMBRIAN The Cambrian rocks in the area of Pembrokeshire can be divided into 3 stratigraphic ranges. These consist of Lower, Middle and Upper Cambrian. Each originates from marine conditions, mainly of shallow marine sediments deposited on the southern shelf margin of the Welsh Basin. The Lingula Flags Formation, Menevian Group, Solva Group and Caerfai Group represent the Cambrian ranges of Pembrokeshire (in the order of youngest first). Caerfai Group (Lower-Cambrian) This group consists of Basal Conglomerate, St Non’s Sandstone, Caerfai Bay Shales and Caerbwdy Sandstone. The Basal Conglomerate is a reddish coloured sedimentary rock that has clear joints and bedding planes. There are large clasts that are present in the rock which are approximately 1 – 20cm in diameter. These are quartz, feldspar and rhyolite flow bands. The rock is classed as a conglomerate as the clasts are held in a finer matrix. Calcite mineral veins were also visible on the rock face. Larger clasts were present at the top of the rock and smaller clasts at the bottom making it a transgressive sequence. The Caerfai shale has a red/pink colour due to the presence of oxidised iron. It is a fine-grained sedimentary rock with some mineral veins present. The mineral veins are approximately 3cm thick. Crystaline tuff is present throughout the rock, which is

Should humans should be responsible for preserving endangered species and natural resources?
Haines ________________ Marina Haines December 1, 2012 ENG-121 The survival of humanity has always been dependent on functioning ecosystems and our natural resources. In the past hunter/gatherer societies had a low population density and were largely nomadic which gave the environment time to replenish and regenerated any resources that were used. As the population increased and humanity advanced, resources were depleted faster with less time for recovery. The species Homo sapiens is unprecedented and unparalleled among all life on Earth in that it’s sentience and intelligence far exceeds those of other creatures. As such it is only natural to question if humans should be responsible for preserving endangered species and natural resources. In Our Vanishing Wildlife Theodore Roosevelt stated: “We are, as a whole, still in that low state of civilization where we do not understand that it is also vandalism wantonly to destroy or permit the destruction of what is beautiful in nature, whether it be a cliff, a forest, or a species of mammal or bird. Here in the United States we turn our rivers and streams into sewers and dumping-grounds, we pollute the air, we destroy forests and exterminate fishes, birds and mammals' not to speak of vulgarizing charming landscapes with hideous advertisement” (In the Words…) Even though President Roosevelt brought these
Copper Penny Lab Report - measuring density.
Is it a Copper Penny? Measuring Density Experiment Date: 30 September 2010 Due Date: 8 October 2010 Is it a Copper Penny? Measuring Density Objective The objective of the experiment is to calculate the densities of pennies and determine the unknown compositions of pennies minted in 1943, and compare the accuracy and precision of the results to the known densities of pennies minted between 1962 and 1982 and those minted after 1982. Materials . Balance 2. 100 mL graduated cylinder 3. 35 pennies minted between 1962 and 1982 4. 35 pennies minted after 1982 5. 35 pennies minted during 1943 6. Paper towels Procedure . 2 pennies minted between 1962 and 1982 were placed and weighed for mass on a balance and the respective mass was recorded. 2. The 2 pennies were then placed in a graduated cylinder containing 20 mL of distilled water in order to find the volume of the pennies inside the water. 3. The displacement of the water, after the 2 pennies were added, was recorded as the volume. 4. Step 1 was repeated using a new set of 13 pennies minted between 1962 and 1982. 5. These 13 pennies were then added to the graduated cylinder containing 20 mL of distilled water and the set of 2 pennies. The new displacement of water was recorded to tenths of a milliliter. 6. Again step 1 was repeated using a new set of 20 pennies minted between 1962 and 1982. 7. The set of 20

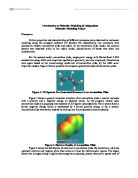
"The tropical rainforest is the most complex ecosystem on Earth, yet human use of this precious resource does not reflect its ecological importance and immense biodiversity." Discuss.
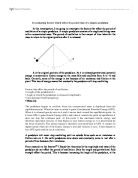
Lee Ka Ying Janice GEOG 1016 Nature Conservation for Sustainable Societies 3rd Written Exercise: Essay Question Attempted: 4 "The tropical rainforest is the most complex ecosystem on Earth, yet human use of this precious resource does not reflect its ecological importance and immense biodiversity." Discuss. Tropical rainforest is a valuable natural resource with the most complex ecosystem on the Earth. Its importance to the global ecosystem and humanis extremely paramount. They are located in low-latitudes areas near the Equator, between the Tropic of Cancer (23.5ºN) and the Tropic of Capricorn (23.5ºS). The majority is lying between 10ºN to 10ºS, commonly found in Brazil, Democratic Republic of Congo and South-east Asia(Figure 1). For the sake of its environmental opportunities available, human carry out large-scale deforestation by cutting and burning the forests to open up more land for development. This threatens the ecology and biodiversity drastically. Figure 1. Distribution of Tropical Rainforest (Source: www.mongabay.com) . Ecosystem of Tropical Rainforests Ecosystem refers to the interaction and inter-connection of energy and matter between biotic components (living organisms) and abiotic components (non-living organisms) (Loreau, M.,Naeem, S. andInchausti, P. 2002). A change in one component will lead to a series of chain effects on the other. Tropical
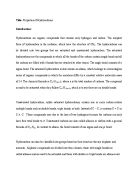
SN1 Reaction: Preparation of Cyclohexyl Chloride
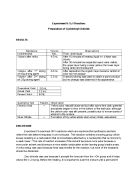
Experiment 8: SN1 Reaction: Preparation of Cyclohexyl Chloride RESULTS Substance Volume Observations Cyclohexanol 5mL Thick, clear liquid Volume after reflux 4.5 mL After 10 minutes of heating liquid in r.b flask was cloudy After 30 minutes two separate layers were visible, the upper layer being a clear yellow, the lower layer being white and translucent Volume after 1st drying w/.45g drying agent 3.6 mL After separation the organic layer became whitish in color but not opaque Volume after 2nd drying w/ .35g drying agent 2.2 mL A second drying was used to obtain a purer product but no change was observed in its appearance Theoretical Yield 5.0 mL Actual Yield 2.2 mL Percent Yield. 44 % Qualitative Test Results Observation Chromic Acid + Yellow color was still observed but after some time dark greenish precipitate began to form in the bottom of the test tube, although the yellow color was still present, possibly due to low amounts of alcohol in the mixture Silver Nitrate + Formation of tiny white solids when silver nitrate was added DISCUSSION Experiment 8 examined SN1 reactions which are reactions that synthesize alcohols where the rate-determining step in uni-molecular. This reaction contains a leaving group which leaves resulting in a carbocation that is immediately attached by a nucleophile that is commonly a weak base. 3 The rate of

Graphical Analysis of Motion
I. Introduction: Equations are great tools to describe a particular phenomenon or situation, but at times, they would not just suffice. We need visualization to further understand what is happening – a mathematical picture called a graph. More than just a visual representation of the relations between certain quantities plotted with reference to a set of axes, graphs give us a complete description of various actual events. A common example of graphs is graphs of motion. Motion graphs come in different forms, depending on which kinematic quantity is assigned to a particular axis. In dealing with motion graphs, a basic model for understanding is the slope - the graded change in the magnitude of some physical quantity or dimension: = That is, if you set time and distance for your x and y-axes respectively, you will be able to derive the velocity; or the acceleration for velocity and time. In this experiment, it is aimed to interpret the different motion graphs through its theoretical explanation and the actual act of doing the motion, done in the graph matching. Along with the graph interpretation is the mathematical computation of the gradients of the graphs: the velocity and the acceleration. This experiment was done through the aid of a motion detector, which detects objects at a range of 30o and with an interface that allows the user to see a graphical

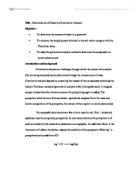
Determination of the density of an unknown liquid
EXPERIMENT 1 Title: Determination of the density of an unknown liquid Objective: To determine the density of a liquid using pycnometer method. Introduction: In order to classify and identify materials of a wide variety, scientists use numbers called physical constants (e.g. density, melting point, boiling point, index of refraction) which are characteristic of the material in question. These constants do not vary with the amount or shape of the material, and are therefore useful in positively identifying unknown materials. Standard reference works have been complied containing lists of data for a wide variety of substances. The chemist makes use of this in determining the identity of an unknown substance, by measuring the appropriate physical constants in the laboratory, consulting the scientific literature, and then comparing the measured physical constants with the values for known materials. This experiment illustrates several approaches to the measurement of the density of liquids and solids. Density is a measure of the “compactness” of matter within a substance and is defined by the equation: Density = mass /volume The standard metric units in use for mass and volume respectively are grams and milliters or cubic centimeters. Thus, density has the unit grams/milliter (g/ml) or grams/cubic centimenters (g/cc). Density determination by pycnometer is a very
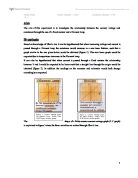
The aim of this experiment is to investigate the relationship between the current, voltage and resistance through the use of a fixed resistor and a filament lamp.
Aim The aim of this experiment is to investigate the relationship between the current, voltage and resistance through the use of a fixed resistor and a filament lamp. Hypothesis Based on knowledge of Ohm's law it can be hypothesised that when increasing voltage and current is passed through a filament lamp the resistance would increase in a non-linear fashion, such that a graph similar to the one given below would be obtained (figure 1). This non-linear graph would be expected due to temperature increases in the filament lamp. It can also be hypothesised that when current is passed through a fixed resistor the relationship between V and I would be expected to be linear such that a straight line through the origin would be obtained (figure 2). In addition the readings on the ammeter and voltmeter would both change accordingly as expected. The shape of a fixed resistor current-voltage graph (I-V graph) is explained in figure 3 since the three variables are related through Ohm's law. Circuit Diagrams Equipment Fixed resistor & Filament Lamp- to impede and obstruct current flowing through circuit Ammeter- to measure current flowing through the circuit Voltmeter- to measure the voltage present in the circuit and to make sure the power supply is correctly calibrated. Power Supply- to act as the adjustable power source for the circuit Wires- to connect the circuit
Investigating factors which affect the period time of a simple pendulum
Investigating factors which affect the period time of a simple pendulum In this investigation, I am going to investigate the factors that affect the period of oscillation of a simple pendulum. A simple pendulum consists of a single oscillating mass with a concentrated mass. The period of oscillation is the amount of time taken for the mass to return to its original position after it is released. A is the original position of the pendulum. As it is released gravitational potential energy is converted to kinetic energy as the mass falls and oscillates from A to -A and back. On earth, some of the energy is lost because of air resistance and friction at the pivot. This loss of energy means that eventually the pendulum will stop oscillating. Factors that affect the period of oscillation: • Length of the pendulum (L) • Angle at which the pendulum is released (Amplitude) • Gravitational Field Strength (g) • Mass (m) The pendulum begins to oscillate when the concentrated mass is displaced from the equilibrium point. When the mass is raised it gains Gravitational Potential Energy (GPE). When it is released gravity acts on it and it moves back toward the equilibrium point. As it loses GPE it gains Kinetic Energy (KE), and when it reaches the point of equilibrium it does not stop but continues past. At this point it has maximum kinetic energy and therefore maximum