I will be using Popper’s concept of falsification as it is important to test the hypotheses and not just prove them correct.
I need to question my method/data and not accept that they will give the best possible result.
5. ETHICS
I will obtaining informed consent before interviewing respondents and will assure them of confidentially and anonymity. I will also make sure that the questions are clear, easy to interpret and that no distress is caused to the respondent during and after the interview. Safety is not an issue to me as all respondents are known to me. Sensitivity will be an issue. If someone gets upset I will ask if they would like to withdraw, but I will be as persuasive as I can to improve the response rate.
THE RESEARCH
THE PRE-TEST
The interview schedule was pre-tested on an East African male aged 19. The answers were recorded by hand. Refer to diary– 15th December.
THE MAIN SURVEY
Introductory letters were posted to all my respondents and appointments were made. The interviews were conducted individually at their homes. Interviews lasted for approximately an hour including 5-10 minutes to create rapport.
ANALYSIS AND INTERPRETATION OF FINDINGS
At the first stage of analysis, I decided to transfer the data from respondents onto 2 large grids (one for the younger and the other for the older age group). One advantage of both grids is that it allowed me to make my analysis more clear and objective.
Hypothesis 1-
The National Identity of East African Muslims in North West London varies with:
1. Age
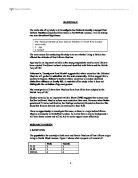
Q14 supports the hypothesis. ‘Do you watch /listen to any Asian television programmes or radio stations?
Figure 2
Both male and female respondents aged between 17 and 21 said that they didn’t watch or listen to Asian programmes, ‘No way, I don’t enjoy watching or listening to anything Asian.’ (R5)
‘We must make sure our children watch and listen to Asian programmes. This way they will not forget our culture’. (R11)
This question supports the hypothesis as I have found that age does affect whether East African Muslims are watching Asian programmes and why they are not. Respondents aged between 17 and 21 may not understand the language used. They may have forgotten their mother tongue whereas Gujarati and Kutchi are the first languages of the older respondents.
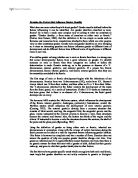
A second question which supports the hypothesis is Q27. ‘How often do you attend Mosque?’
Figure 3
Respondents aged between 17 and 21 have poor attendance as they have an active social life. They also feel lazy and are not as committed to their faith as the older respondents, ‘I don’t feel it is important for me to attend’. (R6) ‘I go for the wrong reasons, to socialise’. (R2)
Two respondents aged between 17 and 21 only attended Mosque on special occasions, ‘I don’t like to go; I make it clear I don’t feel it’s important for me to attend’. (R6) Respondents felt it wasn’t important to go although their parents did force them, ‘My parents don’t force me they’ve given up’. (R6)
Figure 4
The results showed that respondents aged between 40 and 60 tried to attend once or twice a week, ‘to be with people and to experience the atmosphere and closeness’ (R8). Some found it difficult, ‘I try to attend more but cannot because of work pressure’. (R11). Parents found it upsetting that the younger generation are less committed to their faith, ‘My children have lost touch with our faith and hardly attend. It is worrying’. (R12)
Hypothesis 2-
The National Identity of East African Muslims in North West London varies with:
2. Gender
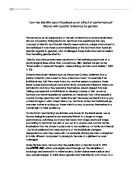
Q9, ‘What country do you hope to live in, in the future?’
All female respondents asked said that they would prefer to live in London in the future. However all male respondents asked said they would like to move to either Canada or the USA.
Female Respondents
Figure 5
Male Respondents
Figure 6
The results support the hypothesis as there is a gender difference. Females aged between 40 and 60 have settled into London and have got used to the British ‘way of life (‘immigrant host model’) whereas the males have not, ‘I still have strong values of my own culture’. (R11)
Male respondents want to be in an environment where there is a big East African Muslim community.
Q15, ‘Do you watch the Queens speech at Christmas?’
Figure 7
Results showed that all male respondents and four female respondents did not watch the queens speech, ‘Never I am a monarchist’. (R10) Whereas two female respondents (40-60) did watch it, ‘Yes because of my respect for her’. (R8)
(R7) ‘No, but I’d like to watch it but my husband can’t stand it’.
Male respondents aged between 40 and 60 have rejected British cultural traditions as they don’t watch the Queens speech.
Q25, ‘How easy or difficult is it to follow your religion in Britain?
Both age and gender did not affect the responses to Q25. All respondents said that it was very easy to follow their religion in Britain. Therefore this refutes both hypotheses.
Figure 8
Q10, ‘In 20 years time do you think that the Muslim community will be less? The same? Stronger?
Figure 9
Age and Gender did not effect the responses from all the respondents .They all felt that the Muslim community would be the same or stronger. ‘It will be stronger as we have a big community and we have a leader who guides us’. (R3) Some respondents were confident that the community would be stronger, ‘No, bigger as I think people will be more knowledgeable and understanding to the cultural background’.
Q12, ‘which international teams do you support in the following sports:
Soccer, Cricket, Rugby and Olympics?’.
All female respondents aged 40-60 didn’t have an interest in sports whilst female respondents aged between 17-21 felt strongly towards England, ‘I did feel proud when England won the rugby world cup’. (R2)
‘I support England as I support the home side’. (R3)
All male respondents both age groups showed support towards England. ‘Olympics, Britain as it is nice to see British athletes winning gold medals’. (R10)
Although all male and female respondents (apart from females aged 40-60) still showed support to other teams, ‘Cricket, India as I am Indian’. (R12) ‘Cricket, India because although my parents are from Africa our ancestors have come from India’. (R3)
Gender and age did not affect the result for Q12,
CONCLUSION
Overall trends falsified hypothesis 1 and 2. There was little difference between males and females from both age groups. However there were some questions which did support both hypotheses but overall not enough as both gender and age did not affect responses.
One interesting finding was that females (40-60) tended to have settled into Britain and like the way of life unlike males from both age groups who said they would like to move to Canada in the future.
EVALUATION
My survey population consisted of male and female East African Muslims due to having more access to this (my own) ethnic group. This made communication and building rapport easier, thus increasing the response rate. However, there may have been sampling bias because non-random opportunity sampling was used to select my quota of respondents. If a sampling frame were available, stratified random sampling would be the best method for giving a representative sample. However representativeness was not a key aim of this study because it was a pilot study.
As a pilot study, a sample of 12 respondents was sufficient for testing my method and hypotheses. However, such a small sample size, because I am a lone researcher thus time reduces the chances of the sample being representative and generalisations cannot be made. Having two variables (gender and age) of equal for comparison made the sample more representative, but deliberately choosing one ethnic group made my study less representative.
As this is a pilot study I am unable to generalise from the data as I have a small sample. The representativeness will increase if I had a larger sample.
I used semi-structured interviews, which interpretivists believe is more likely to generate valid answers. Open questions enabled my respondents to speak freely about their identity.
I used both open and closed questions which gave me quantitative data favoured by Positivists and qualitative data preferred by Interpretivists. I avoided ambiguous questions to ensure that each question was open to one clear interpretation and that it had the same meaning for all respondents.
My study is reliable as I used the same interview schedule for all the respondents, which can be re-used to replicate the study. However four extra questions were only asked to the 40-60 year olds as it did not concern the younger age group. Being the only interviewer also increases the reliability.
The interviews were conducted in the respondent’s homes and increased validity because it reduced nerves or tension. However, the answers may have been affected by variations, such as mood and environment. This may decrease the reliability and validity of the study.
Due to the interviews being carried out individually answers were not affected by the presence of others. This increases the validity of the responses. I tried to steer clear of interviewer bias by avoiding any facial or non-verbal cues.
The interviews lasted approximately an hour, I felt that respondents lost interest and gave ‘yes’ and ‘no’ responses. This affected the validity of my study.
As I knew the respondents, rapport was not a problem and this could have improved the response rate therefore providing more honest answers. However, there is a danger that respondents may not have given me accurate answers as they may have feared being judged.
To tackle the issue of validity, I aimed to reduce interviewer bias (Bowling, 1997) by making sure I did not influence the respondents answers in any way. However in cases of non-response, I had to prompt the respondent and this may have led to the imposition factor where I might have imposed my view on the question.
I have tried to be objective towards the study by following Cicourel’s concept of reflexivity by being aware to possible biases. As I was open about myself and how I felt I may have encouraged respondents to agree with me. Hence the validity of my results could be questioned.
As I did not tape record I may have missed out some responses as I could not write everything down and my subjective decision as to what to leave out and include could have been influenced by my hypothesis.
All respondents offered their informed consent to participate in the study. Therefore, this makes my study more ethical. The guarantee of anonymity and confidentially of data may have increased the validity of the answers.
When analysing the data I made sure that I did not leave out any responses that I felt were not right. By doing this I tried to falsify (Popper) my hypotheses as well as support it.
Evaluation of findings
I adopted Popper’s view and attempted to falsify my hypotheses by being unbiased in my analysis, consequently making my findings highly valid. Both hypotheses supported the findings as well as refuting them. This indicates that I have not been biased in my analysis, hence increasing the validity of my study.
Unlike my expectations of females being more committed to their faith than men (Butler) female respondents (40-60) tended to have settled into Britain as well as keeping strong ties with their own and Traditional cultural values. They have identified themselves with Britain and the British ‘way of life’.
Ideas for further development
In order to develop my research, I can expand my target population by including different variables such as interviewing other ethnic groups to make comparisons or choosing East African Muslims from different localities (e.g. North West London and South West London). I could also repeat this study using the exact same sample to see whether the views of the respondents change.
In the future, a longitudinal study could be taken place. However it is not practical due to cost, drop outs or the Hawthorne effect. To increase the validity, interviews cannot be too long otherwise the respondents can lose interest and concentration.