Table 5 presents details of industry of employment of all people aged 16 to 74 (Open University, 2011). The highest percentage of employment is within Real Estate at 18.1%. This could be due to high density housing in the area. There is no employment within Fishing or Mining and quarrying. It shows slightly higher employment within Education (8.2%) and Health & Social work (13.2%) than England and Wales, and a similar percentage of employment within Public admin & defence. There is also a slightly higher percentage of employment within Hotels and catering (6.7% compared to 4.8% in England and Wales) which indicates that there are a higher than average amount of hotels in the area.
Word count: 516
References:
DD101 Introducing the Social Sciences (2011) Assignment Booklet 2011B p. 22, 25 – 27, Milton Keynes, The Open University.
Based on the information contained in the text and photograph below, what can you say about the identity of Stratford, its residents and prospective visitors?
In this essay I will be looking at the text and photograph provided and examining the discourses, the identities that appear within it, and which of those are positively and negatively valued.
The authors of the text, Newham Borough Council, begin by talking about the 2012 Olympic Games, explaining that Stratford will be at the centre of London’s plans. The discourse focuses on details about the stadium being built, and the new development of Stratford City which will contain new homes, office space, hotels, schools and a shopping centre. It also mentions the transport connections, and paints a picture of an up and rising area with plenty to offer. There is great emphasis on the transformation, and very little information on any history of the area, until further on in the text when it mentions a church with a 19th century organ, and two Victorian architectural landmarks – a library now part of the University, and the Old Town Hall. With the focus being on the transformation, there is a partial similarity to ‘urbanisation’ (Hinchcliffe, 2009, p.212) as there will be a large increase in the population living and working in the area.
There is a big emphasis on how diverse the population of Newham is, with it mentioning that more than 100 languages are spoken locally. The image presented is that it’s a vibrant, multicultural area which is rich in atmosphere. I am reminded of Doreen Massey’s description of “throwntogetherness” (Hinchcliffe, 2009, p.228) and how that can also be used to describe this borough. Throwntogetherness is a way of explaining how different people, with different values, backgrounds and experiences can come together and give an area its character, charm and identity. This seems to be the image the council is trying to create, especially when describing the area as one where “local people take great pride in being part of a global village.”
Youth is one of the identities that is focussed on within the text. It is stated that over 40 per cent of the 254,000 population are under 25 years old, and describes Stratford as a welcoming place, with warmth, friendliness and community spirit. It details many activities that could be enjoyed attending the theatre, cinema, restaurants and shops. It is clear from this that consumer identity is positively valued, and the ability to spend money is important. There are no references to the older generation, no indication of any activities they may specifically enjoy, and no mention of disabled access. It could be said that the older generations, those with disabilities, or those in low paying jobs are the excluded identities, and are disconnected from the redevelopment of Stratford.
Another identity that is positively viewed is that of the family. The beginning of the text mentions 4,500 new homes being built, and schools, and goes on to detail sell-out pantomimes at the theatre, and the Discover Story Making Centre which was named one as one of the ‘Top Five Days out in London for Children’ Families are clearly important for the redevelopment of Stratford, perhaps to ensure the ‘sustainability’ (Hinchcliffe, 2009, p. 239) of the area after the 2012 Olympic Games are over. If Stratford was only to appeal to tourists for that period of time, there would be no guarantees of how it would continue to prosper without permanent residents.
Consumer identity is additionally an important identity to the council, the details of numerous shopping centres, bars, restaurants, theatre, a ‘Cultural Quarter’ with cinema and performing arts venue. It shows a consumer identity as a positive one for Stratford. You are given the image of a busy and vibrant city with numerous people interacting every day. With people of varied backgrounds, cultures, ethnicities and languages there could potential issues, but some form of a collective identity.
It brings to mind the theory of Harold Garfinkel (cited in Taylor, et al., 2009, p.173) of social life being in constant motion, yet not chaotic because people have the skills and knowledge to create and maintain a social order in each situation.
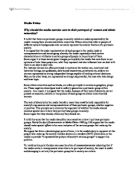
The photograph that has been used alongside the text strikes me as an odd choice. It features two white women, sitting in a cafe having a conversation over coffee. They are the focus of the photograph, with the surrounding appearing to be slightly blurred. The photograph is meant to show a young, relaxed image, perhaps even to be viewed as cosmopolitan, watching the world go by as they chat. The sunlight is highlighting them, ensuring they are the focal point, and you don’t immediately notice that there are other people sat outside the cafe, as you cannot see their faces. It seems a strange choice of photograph, as the text accompanying details how diverse the population is, how many languages are spoken, how this makes the area rich in culture and atmosphere, but none of this is evidenced in the photograph. It is a very staged photograph, used to create an imagined identity, but not one that is accurate for the area it is meant to be representing. The photograph makes me think of Erving Goffman’s views (cited in Taylor, et al., 2009, p.172) where he describes social behaviour as ‘dramaturgical’, as though we are people in a play trying to give our best performance. The photograph appears to me to be far too staged, and the people present in it clearly acting a role. I feel a better choice of photograph would have been to show a busy street, perhaps with people shopping, depicting a more representative view of the different cultures and ethnicities there are within Stratford.
To conclude, the text by Newham Borough Council presents a vibrant and multicultural city, with a big new development scheduled and a lot of detail about its involvement in the 2012 Olympic Games. There are numerous details of places to visit for entertainment, food and shopping, and it is very much geared towards youth, family and consumers. The text is very upbeat and written to make you feel as though you want to be part of this new city. However, I feel it is very let down by the photograph they chose to publish alongside the text. None of the excitement or vibrancy of the city is visible in this photograph, and I believe that it excludes a lot of people as it contradicts many of the details in the text about the diversity of the population.
Word count: 1069 words
References:
Hinchcliffe, S. (2009) ‘Connecting people and places’ in Taylor, S., Hinchcliffe, S., Clarke, J. and Bromley, S. (eds) Making Social Lives, Milton Keynes, The Open University.
Taylor, S. (2009) ‘Who do we think we are? Identities in everyday life’ in Taylor, S., Hinchcliffe, S., Clarke, J. and Bromley, S. (eds) Making Social Lives, Milton Keynes, The Open University.