To investigate the movement of osmosis through a potato sample.
Osmosis
Aim: to investigate the movement of osmosis through a potato sample.
Hypothesis: Osmosis is the movement of water through a semi permeable membrane, separating solutions of different concentrations. The water passes from a region of high concentration to a region of low concentration, until the two concentrations are equal in concentrations of water.
Many cell membranes behave as semi permeable membranes, and osmosis is a vital mechanism in the transport of fluids in living organisms, for example, in the transport of water from the soil to the roots in plants.
If a cell is in contact with a solution of lower water concentration than its own contents, then water leaves the cell by osmosis, through the cell membrane. Water is lost first from the cytoplasm, then the vacuole through the tonoplast. The living contents of the cell contracts and eventually pulls away from the cell wall and shrinks, this is known as Plasmolysis.
If you put a plant cell in water, water enters by Osmosis, then swells up. However, the cell will not burst. This is because plant cell walls are made from cellulose, which is extremely strong. Eventually, the cell will stop swelling, and when this point is reached, we say the cell is turgid. This is important, because it makes plant stems strong and upright, supporting the plant.
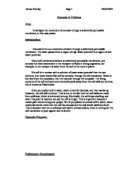
Osmosis diagram:
water molecule semi-permeable membrane sugar molecule
high concentration of water low concentration of water
I predict, that as concentration increases, the weight of the potato will decrease. My reasoning behind this, is that the higher the concentration of glucose in a solution, the lower the concentration of water. When the potato chip is put into the solution, it will, through osmosis, lose some of its water, and the water will diffuse into the solution of glucose, causing the potato chip to lose water, and so decreasing in weight.
However, if the potato sample is placed into a solution with a 0% sugar concentration, it should gain weight. This is because the solution has a greater water potential (its molecules' ability to move) than the potato sample, and so water moves from a region of high concentration (the solution) to a region of low concentration (the potato sample.)
Predicted graphs
I predict my graphs will look like this because the potato sample used for 0% sugar concentration will gain water, as the water will move from a region of high concentration (the solution) to a region of low concentration (the potato sample.). However, in the middle of the scale, say 0.6% sugar concentration; the graph will go right down, due to the fact that the solution will be isotonic to the potato. In other words, the solution and potato sample are just about equal in concentration. The reason for the minus results for the 1% ...
This is a preview of the whole essay
Predicted graphs
I predict my graphs will look like this because the potato sample used for 0% sugar concentration will gain water, as the water will move from a region of high concentration (the solution) to a region of low concentration (the potato sample.). However, in the middle of the scale, say 0.6% sugar concentration; the graph will go right down, due to the fact that the solution will be isotonic to the potato. In other words, the solution and potato sample are just about equal in concentration. The reason for the minus results for the 1% sugar concentration is that the solution will have a lower concentration of water to that of the potato, and so, by osmosis the water will move from the potato sample to the solution, causing the weight to decrease.
Preliminary Work: In a sense, preliminary work is as important as the actual experiment. It allows you to make hypotheses before performing actual tests. It helps us to make more valid hypotheses.
For my preliminary work, I used 33mm of potato. It was easy to cut 33mm and get it to weigh around 1g. To begin, we used 15mls of Glucose solution- this was the amount needed to cover one piece of potato. The first thing we needed to observe, was how different concentrations affected the weight and length of the potato. We therefore needed to observe each end of the spectrum. We tried 0.2 molar concentration (the lowest) and 10 molar (the highest.)
We then left each test for 5 minutes, but found after that time no reaction had taken place. It was then we predicted we would have to leave the tests for at least triple that time.
Again, we used the same proportions of potato chip, concentration and amount, but changed the length of time the tests were left for. This time we left them for 15minutes and saw that the results we collected were much easier to compare because there was more of a range.
Equipment:
* 6 Boiling tubes
* test tube rack
* potato cylinders
* measuring cylinder
* solution/ sucrose
* scales
* syringes
* cork borer
* timer
Diagram:
Method: Having done my preliminary work, I knew exactly which measurements we needed to use in order to obtain the correct sort of results.
We set up the 6 boiling tubes in the test tube rack, having been labelled in order, 0.0%, 0.2%, 0.4%, 0.6%, 0.8% and 1.0% - for the sugar concentrations. We filled these up with the correct solutions. The amount of the solution does not really matter, as long as the sample is fully immersed, as the concentration will remain the same.
We then cut up 6 pieces potato, with a potato cylinder, each weighing approximately the same weight, around 6g ideally so as to keep a fair test, and keep the surface area the same. Having carefully weighed the potato samples and noted down the weights we placed the samples in to the different solutions and started the timer for 20 minutes. We tried to do place the samples in at the same time, so that it would remain a fair test and so that not one sample had a longer time in the water than any other.
After twenty minutes swiftly remove the samples from the solutions and carefully dab off any excess water from them. Quickly weigh them, as they may be losing water through evaporation.
We pooled together the class results so as to be able to get, hopefully, a more accurate final reading. Ideally, we would have liked to have taken all of the extra readings ourselves but due to time constrictions, we were unable to do so. In doing this we were able to compare results and find an average for the results.
Fair Test: In order to keep the experiment as a fair test, a number of things had to be carefully monitored. I ensured that each potato sample spent almost exactly the same amount of time in the sugar solution as each other so that the results were not massively affected and so that not one potato sample spent more time in the solution than any other.
Inevitably, when the potato samples were taken out of the water, they had some excess solution on them, so to try to overcome this problem, and not affect the weight of the potatoes, I attempted to dab off this water with tissue paper.
So that the surface area would not be affected greatly I tried to keep the dimensions of the potato the same, to keep the results as unaffected as possible.
Results
Sugar solution concentration (%)
Difference in Mass of the Potato sample of the final mass from the initial mass (g)
Result 1
Result 2
Result 3
Result 4
Result 5
Mean Average
0.00
0.10
0.60
0.00
0.30
0.00
0.20
0.20
0.10
0.10
0.10
0.40
0.10
0.16
0.40
0.20
-0.30
0.10
0.20
-0.10
0.02
0.60
0.00
-0.20
-0.10
0.00
0.10
-0.04
0.80
0.00
-0.10
-0.10
-0.20
-0.30
-0.14
.00
-0.20
-0.10
-0.20
-0.20
-0.10
-0.16
Analysis: This graph shows almost exactly the result that I expected to find.
To conclude this investigation, I can say that the movement of water through a selectively permeable membrane is affected by concentration of glucose solution, or by any other solution. The higher the concentration of glucose solution, the more the potato sample will lose its weight.
Because water molecules have kinetic energy, they are constantly moving around in gaseous or liquid form, moving randomly from one place or another. The greater the concentration of water molecules in a system or solution, the greater the total kinetic energy, and the higher its water potential. This means, that as the concentration of glucose increases in a solution, the concentration of water decreases, lessening the solution's water potential, and lessening its ability to move between solutions by osmosis. Relating this to the potato samples: basically, as the concentration of glucose in each solution increases, the water in that solution is less able to move to the potato, causing water from the potato to move to the solution, decreasing its weight.
An Osmotic system is formed when a semi-permeable membrane is placed between two solutions. In biological systems osmosis is the exchange of water between the toplasm and the surrounding medium, with the plasm membrane being the semi- permeable membrane.
In the living cell, both the cell wall and plasma membrane determine the permeability of the cell, but the plasma membrane is the least permeable of the two. The ability of a substance to pass through these barriers is known as the permeation of the substance. Because not all substances may pass into or out of the cell, the cell surface is known as a semi permeable membrane. The semi permeability varies from cell to cell and under certain conditions.
Water molecules alone permeate freely, but many large molecules and nonelectrolytes, such as sugars, do not move at all. This indicates that temperature could also affect osmosis. A solution in which the concentration of salt is greater than that inside the cell is called a Hypertonic solution and will cause a cell to become plasmolyzed. In other words, the cell becomes dehydrated and loses water through plasmolysis. If the concentration of the sugar solution outside the cell is less than that inside the cell, this means that the solution is Hypotonic to the cells of the potato sample. The water will diffuse into the cells, making it turgid.
Evaluation: Accuracy, in this experiment proved to be extremely difficult to maintain. For example, we had to, for as much as possible, keep each potato sample the same surface area, and weight. However, putting this into practice wasn't easy. It was very unlikely that all of the potato samples would weigh the same amount and have exactly the same surface area. This inaccuracy was due to human error, it is very difficult to make the 6 potato samples exactly the same. In future, I would make a template to try to make all my potato samples exactly the same. This however would be extremely difficult to achieve.
When weighing the potato chips after 20 minutes in solutions, it was inevitable that they would have excess water on them, so in order to solve this problem we dabbed them with tissue paper to attempt to remove it. However, in doing this we could have removed water that was not excess, thus possibly altering our results.
Another inaccuracy may have occurred when we put the potato sample into, and took them out of the solutions, because it was impossible to not leave a small interval between each test tube. The first test would have been going for a few seconds longer than the last. This problem, again due to human error, would be very difficult to fully correct but we could have sampled each sample in turn or staged the experiments to try to remedy this problem.
I could extend this experiment into osmosis by investigating osmosis with a different factor as opposed to concentration of water. I could investigate the effects of temperature on osmosis, or surface area, or even the effects of osmosis in a different vegetable or plant. I could also examine the effects on the length and width of a potato sample. This would give me a very clear understanding and knowledge of osmosis.
References:
Collins, 1999 'The Biological Dictionary'