R1 = (Ta-Td) C = ΔT C
The formula above is the equation to obtain the measured range, R1. We need range because in order to identify a position fix the principal involves the measurement of distance to three satellites of known position.
C represents the velocity of light, ΔT is the difference in time from when the satellite transmits a signal to the receiver and another name for this would be ‘delay time’. However the’ delay time’, ΔT is incorrect. The reason for this is because the time difference is wrong. This can be overcome using four satellites instead of the original number of three. The latter makes the distances calculated ‘pseudo ranges’ because it recognises error and biasness in ‘time delay’, ΔT C.
So the question arises of, how we calculate exact timing on both clocks? What is meant by clocks, the clock in the satellite and the clock in the receiver. The clocks will need to be perfectly synchronised. It is known as ‘pseudo ranges’ because a correlation procedure using pseudo random binary codes is used. It works in the following way, there are two types of binary code, P and S code. In this case the S code is used. When the receiver gets a transmission from the satellite, it releases the S code. This is then cross correlated with the satellites code, hence the determination of time delay, ΔT can be found because it generated the same code received from the satellite to the receiver.
However the pseudo-range is only suitable for navigational purposes a more precise measurement of range is needed for positioning in engineering surveying, for surveying carrier phase ranging is required, whereas with pseudo-range the L1 and L2 bands are modulated to P and S codes. This is the opposite in carrier phase ranging, the measurements depend on the carrier waves themselves. I.e. the observation does not use codes.
Another difference about both ranging modes is that when the signal is transmitted from the satellite to the receiver, it is different to that of the original transmission this is because of the relative velocity, this is known as the Doppler Effect. The carrier phase is therefore ever changing according to the signal transmitted signal.
Data processing
Geoid
The actual surface of the earth cannot be defined in terms of a mathematical shape, it is what’s called an oblate spheroid. Another way of evaluating the earths shape is known as a Geoid, which is defined as the equipotent of the earth’s gravity. I.e. the mean sea level. It uses the ‘mean’ because of unavoidable forces acting upon the waves of the water which cause the sea level to deviate at time up to 2 meters from the Geoid. This was mentioned by J.B.Listing in 1872 as the geoids inconsistencies. Also the solid earth’s actual surface is too irregular to be represented by a mathematical relation, the Geoid. However because the Geoid is the surface to which all terrestrial measurements are related, it remains an important part to the surveyor.
Figure 4 Geoid Diagram
Geodetic height
Surveyors use the common Cartesian co-ordinates of latitude and longitude to define relative positions, however the third element of elevation, i.e height is not mentioned. In order to calculate further in-depth findings, elevation is needed. A classic determination method would be by sprit levelling, this is where the ellipsoidal mathematical numbering comes into play. The ellipsoid is not a physical reality it is merely a concept, it represents the earth having a smooth shape, and the reason for this is because calculations can be done to get the ellipsoid distance and co-ordinates. To convert the ellipsoid height given by the GPS observation into an orthometric elevation, i.e. height is to know the Geoid-ellipsoid difference at that point. H= h-N where h = ellipsoid height & N = elevation.
The National Grid
For over 200 years the agency known as ordnance survey (OS) has been responsible for the mapping of Great Briton. Their construction, lead it to be used during both world wars, for example, in geological surveying. Its modern day use would be in scientific areas and also commercial and industrial sectors as well as the military.
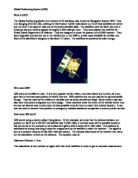
Following on from the OS, the Transverse Mercator project went ahead, i.e. the basis of the National Grid was formed (NG).The NG uses units of meters and is superimposed on almost all amps. The reason being is that it will give the map reader a single-reference systems as well as a number for large scale maps. The figure below shows this, the lines over the United Kingdom are not real. The lines are at right angles (90º) to the central meridian. Basically this creates both northing and easting co-ordinates, i.e. x and y values in mathematics.
Figure 5 http://www.aditsite.co.uk/assets/images/ukossheets.gif
Showing the gird reference for the United Kingdom.
GPS Methods
There are many different GPS field procedures all with varying degrees of accuracies. In navigation, pseudo-range measurements are used. For fields like civil engineering, carrier frequency phase measurements would be suitable where the L1 carrier is 19cm to mm accurate and the navigation S-code (C/A) is about 30 mm in accuracy.
The problem with carrier phase and pseudo-range measurements is that there are timing and propagation delays. However this can be solved by a few calculations, hence different methods are introduced to eradicate or minimise this disadvantage.
To understand this better here are a few general terms explained,
L1 and L2
These are basically frequencies and are just carriers of codes.
P code
This is short for precise code. Satellite broadcasts have both L1 and L2 frequency broadcasting to the GPS, however because they are different the GPS needs to define which transmission is from which satellite. This is where the P code comes into play.
C/A code
This is much slowly broadcasted to the GPS than the P code, so in turn identification is very simple. This code is repeated every millisecond on the L1 frequency which makes C/A code unique to every L1 frequency.
Static positioning
This was the first positing system for GPS surveying and since its introduction it is still used today. This surveying technique takes around 30 minutes to 2 hours. The reason for this is because the satellite can take multiple readings from different positions which in turn would minimise systematic errors. If this type of field process is to work it needs one or more receiver and 2 or more satellites. The data is then collected and simultaneously processed to the user which then gives a position fix.
Also if the user is surveying over large areas, say a few miles, static processing would be a good idea to use, since it is used to determine the length of long baselines and has the advantage of 5-10mm accuracy. For measurements of a shorter range the carrier phase errors can be ignored because of the high accuracy static has incorporated. It works like this, the surveyor with the GPS receiver sets up over a known position with coordinates x,y,z. then using a different receiver the user stands over a position which he/she wants to know.
To understand why this process needs time is because of the ‘cycle ambiguity problem’ this is where it needs time to solve the integer number of cycles between the satellites. This is one of its drawbacks, in that static processing is to slow but accurate.
Rapid static
Very closely related to static positing but with a difference in occupation time, where static takes hours, this method only takes minutes. To achieve a shorter time has something to do with the ambiguity problem discussed above. There are two ways in which the problem can be eradicated, the problem of occupation that is. Often the problems money is thrown to solve it, one way would be is to have very expensive equipment and software, which could calculate equations very rapidly. This is the simple way of solving a problem but expensive. A less expensive approach would be to combine carrier phase with p-code measurements which would then get rid of the least squares solution for ambiguities and the combination of both the measurements would involve search routines as the GPS receiver is well capable of doing.
Where static positions can take up to two hours, rapid static can reduce this time to around 20 minutes, a technique called wide laning makes this possible. Basically the GPS frequency bands L1 and L2 are put together in a linear combination, when both L1 and L2 are combined, 2 distinct signals arise. One is called narrow lane and the other wide lane. Also one is slower than the other and the wavelengths are different compared to L1 and L2. Ultimately these changes make the resolution much easier and a bigger wavelength increases the spacing of the ambiguity.
A major advantage with rapid static is that the user can move around with the GPS receiver and not have to worry about what position the satellite is fixing too. This method is ideal if there are many points to be surveyed.
Kinematics
This method of positioning is faster than static. It achieves this by suing the same field process as static where one receiver is in a known position of x,y,z coordinates and at least one receiver moving form point to point. When at a point of unknown coordinates the receiver only stops here for as little as two minutes before moving on to the next location, this is where it differs from static positioning. Another difference is that the data collected, shows not only x,y,z but also vectors between themselves and the original receiver of known coordinates.
Re-occupation
Similar to both static and rapid static re-occupation works by going over the survey after a time gap of around two hours. It takes this long because of the satellite and the surveyor with the GPS receiver, the reason for this is when either of the equipment relocates, it alters the geometry to resolve the ambiguities.
The techniques used here starts off the same as static positing. The master receiver, i.e. the receiver which has known coordinates of x,y,z is placed in position.
The other receiver is then used to find particular unknown points, once completed the cycle is started again and the second GPS receiver does exactly the same as the first time.
To combat the problem of ambiguity this method uses the first few readings and the last few readings for which show the difference in receiver/satellite geometry.
Stop and go kinematics
Almost identical to the description above, but as the name suggest, the GPS receiver which determines the unknown position fix stops at that position. Time here can vary from a few seconds to minutes. Once stopped the correction is then made on individual positions unlike before where it was on a trajectory route.
The problem of ambiguity is solved at the beginning of the process using various techniques. Another requirement is that for this method to work the moving receiver must maintain lock onto at least 4 GPS satellites or it will not work. This in turn renders it useless in areas where there are tunnels, woods, towns etc. i.e. where signal shading occurs.
Traditional kinematics
Surveying the traditional way is very simple to the other types of kinematical techniques described above. However in this case the rover, i.e. the moving GPS receiver is constantly moving at a very slow pace. One receiver is stationed over the position of known coordinates. The rover basically moves over the points where the surveyor wants to know the position point. For all this to work lock must be maintained too at least 4 satellites. Traditional kinematics is used for a quick survey of linear details such as roads, railways, rivers etc.
Real time kinematics RTK
As the name suggests, the position of an unknown point can be found in real time, i.e. almost instantaneously. With the other methods described before it never gave the position fixes instantaneously, the surveyor either had to wait for computer calculation or they themselves had to calculate it using raw data.
This method uses mobile data communication to transmit information from the reference point to the moving rover. The transmission from the reference point sends carrier phase data to the rover, then the on-board computers resolve ambiguities and also solves for differences in coordinates.
Uses of GPS
Other than surveying GPS can be used for many different purposes and industries. The use of mobile phones is ever increasing and with the latest handsets comes GPS navigation. So for certain agencies in the UK the whereabouts of individuals can be located providing the phone is switched on. Also on a large scale the users of GPS are oil producing companies, so that they can find an appropriate route for oil pipelines and once established maintain its existence, GPS is used for surveying platforms. The reason why GPS is used in this field is to reduce the number of large scale disasters, i.e. tanker spills.
Just like the mobile phone, GPS devices in new cars can find there way around new areas, weather it be other countries, cities, towns etc with the help of the map displayed on the GPS receiver.
GPS can contribute to saving lives, with the recent earthquake in South Asia and mother natures countless events GPS can be used in geo-tectonic research (in earthquake movements). It does this by keeping track of minute shifts in the shape of the earth’s surface. Overall the introduction of GPS has saved many lives and made people’s everyday lives easier there isn’t much criticism about GPS, apart from the expensiveness of the product and the handling and understanding of it to a novice user. But this can be overcome by means of background reading and manuals supplied with the product as well as manual demos.
Reference:
J.Uben & W.F.Price, Surveying For Engineers
Jan Van Sickle, GPS for Land Surveyors
W.Whyte, R Paul, Basic Surveying
N.Short, Lecture Notes, 2004.
Personal Achievements during the Course
Team work
At the beginning of the task, there were 5 members in our team. But differences arose as to who would be a better leader, which resulted in our team having 4 members for the remainder of the surveying course, which became a disadvantage, however we pulled together well and certain tasks were assigned to certain people, which gave reliable and accurate result, an example of this is, that our levelling absolute error was 11mm. Personal I learnt how to listen to instructions, follow surveying procedures and was able to express my opinion of how certain tasks should be carried out and I felt that I was listened too.
Surveying Techniques
At first the task seemed difficult to grasp but I can honestly say that I learnt more about surveying during that week than I would have from books in that amount of time, I believe surveying is easier to learn practically. Basic equipment such as the ‘Scope’ and the ‘Staff’ for the levelling exercise from the OBM to our point 1, needed to be read correctly because if these readings were incorrectly recorded here it would result in the whole exercise being in error. I found the levelling exercise to be least difficult from all the tasks because of the understanding of the group and equipment.
The reason for levelling to point 1 was because it would have being impractical to ‘detail’ around’ the library and level off to the Woodcock sports gym. Overall the course allowed me to make friends with different people and I was able to see if I could cope within a surveying working environment, which I think that I did well considering we lost a member of our team early on and had a few discussions about certain objectives we weren’t agreeing on.
Surveying Procedures
The group walked around the library marking points where the stations should be placed, they had to be in certain spots because the stations needed to be intervisable between each other. In total we had 7 stations around the library and using the theodolite the group took it in turns to measure the angles between stations and distances. Together with angles and distances between surrounding trees, walls etc. what I learnt during this task is that both concentration and use of equipment accurately needed to done to get accurate answers. I also found that to set the theodolite the user needs to rotate it 360ºc horizontally and then 360ºc vertically to get the theodolite to re-set.
In surveying as well as the practical field procedures the data needed to be accurately recorded and worked on, I did a lot of checking to see if the data was accurate and I recorded the measurements myself when other group members were carrying out the practical work. I felt communication between the group was constructed effectively.
Diary of summer 2005 Surveying Course
The group on Saturday mourning went out and walked around the library to locate positions which needed to be intervisable between stations, the diagram below shows the general layout of what the team collectively decided would be the final positions of the stations. This task took no long than 2 hours, which we then had a general idea of what to do on Monday.
Monday: day1
Levelling exercise from the woodcock sports centre to station1 was conducted by Andrew Baily and Thomas Docker, whilst they were doing this myself and Henry were conducting the levelling between station, shown on the map above. To ensure we did this correctly we did this a few times to see if we could get the same data as before. I believe the group levelling to station 1 did there exercise 4 times again to get accurate readings. The group took it in turns to use the instruments so that everyone would be able to see and learn what exactly was going on. At this point Sarab Jit was the group leader, but I felt and other members felt he did not know what he was doing, but we never said anything. However the levelling exercise was completed on this day, with very accurate results.
Tuesday: day2
Angles between stations was our second task to be carried out, I felt that if we worked together on this task we would get a better understand of the equipment and reasons why we do certain measurements in particular ways, because it was mentioned , that the group should split into 2 groups again. In the end my decision was undertaken. Using the theodolite we sighted to station2 from station1 and then extracted the data, and then we sighted to station 1 from station2, to give the distance and angles. We did this throughout the day, but because we did not know how to start off, it took sometime to get going, we called it a day at station5. Events on this day, reduced our team count to 4, Sarab Jit decided that the whole course was not for him and he left the group, Andrew Baily was then allocated group leader.
Wednesday: day3
Carrying on from yesterday, we managed to finish of the final three stations, which were stations, 5, 6 and 7. We did not have any problems on this day because we knew what we were doing and I made sure that everyone was taking turns in handling the equipment so that they learn. Around the university there were other groups conducting similar exercises, but were falling behind and so we called it a day, because we were ahead of them all. Another reason was because we did not want to rush the detailing of the area, as we knew this would need concentration.
Thursday: day4
Detailing of the area around the library, here we decided what should be detailed and what should not, because it was not practical to detail every item around the area, we decided to detail large objects, which ranged from pillars to flower beds. The whole day was spent detailing however we did not manage to finish the detailing.
Friday: day 5
The final day, on this day detailing was completed and the group sat down and looked at the data to see if it ‘looked’ correct and that there were no major problems or concerns in general about the week.
Members of group: Imtiaz Ali, Andrew Baily, Thomas Docker, Hoi Wing Cheung