An experiment to investigate the effect of enzyme concentration on the rate of milk lipid digestion by lipase.
Adam Hussein 6B1 28-12-02
An experiment to investigate the effect of enzyme concentration on the rate of milk lipid digestion by lipase.
Biology Coursework Plan:
Aim:
This investigation aims to find out how enzyme concentration affects the rate of milk fat digestion by lipase enzyme. As a result of the experiment I aim to have quantitative results which I can then use to plot graphs illustrating the effect of lipase.
Prediction:
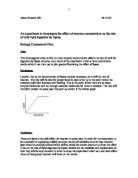
I predict that as the concentration of lipase enzyme increases, so to will the rate of reaction. The two will be directly proportional to each other up to the point where the substrate (milk fat) becomes rate limiting. This is the point where there are so many enzyme molecules and not enough substrate molecules for them to catalyse. The rate will therefore remain the same past this point as shown in the below graph.
Variables:
These are factors that will affect the reaction in some way. In order for the experiment to be successful in supplying reliably accurate results all variables must be kept constant apart from the enzyme concentration will be varied by known amounts to show the effect it has on the rate of lipid digestion by lipase. Below are the variables and explanations on how they will be kept constant in order to keep this experiment a fair test, and what affect them not being kept constant will have on the results.
- Bile concentration:
==> What is it:
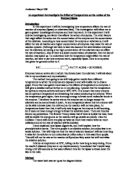
Bile is an alkaline substance due to it containing sodium hydrogen carbonate. It is this that neutralises the stomach acid before entering the duodenum through a sphincter. It is very important because without it the enzymes secreted by the pancreas (in pancreatic juice) would be denatured by such extremes in pH. What assists the digestion of fat are the bile salts contained in bile. These help by emulsifying the large fat droplets into tiny droplets called micelles, thus increasing the surface area that the enzyme lipase has to work on therefore increasing the rate of reaction. Bile is produced in the liver and stored in the gall bladder near by. It is transported to the stomach through the bile duct. Below is an emulsification diagram, showing first, a large lipid droplet with only a small number of enzymes able to work on it. The second diagram shows small lipid micelles after being emulsified by bile. The effect that bile has on lipids can be clearly seen. Many more enzymes can work on the same amount of lipid once emulsified, resulting in a quicker reaction.
==> How it affects the reaction:
Bile concentration can greatly affect the reaction. It is not only altered when more or less bile is added but when more or less milk fat is added. The affect of increased concentration should results in a quicker rate of reaction. This would be due to more collisions between the bile salts and milk fat droplets, either down to there being more bile, or less milk fat consequently resulting in their being more bile available at one time to emulsify the milk fat droplets. The increased collisions will mean more surface area for the lipase to digest the fat from quicker resulting in a quicker, yet equal pH change. However there is a limit to this variable having an affect. This limit will be reached when the bile concentration gets so high that there is simply not enough lipid for it to emulsify all at once.
==> How bile concentration will be kept constant.
Most obviously the same type of measuring instruments will be used each time and the same measures (2cm3 ) will be taken, using the same graduated pipette.
- Lipase concentration:
==> What is it:
Lipase is an enzyme, a biological catalyst, which as the name suggests digests lipids. One lipid molecule is digested into three fatty acid chains and one glycerol molecule. All enzymes act in a way to reduce the activation energy thus speeding up the rate of a chemical reaction, while also not being consumed during the reaction.
==> How it affects the reaction:
The rate of the reaction between enzyme (lipase) and substrate (milk fat) is directly proportional to the enzyme concentration up to the point where substrate concentration exceeds enzyme concentration. This is simply due to more enzyme molecules being present to react and catalyse the reaction. Also as the enzyme concentration increases, the faster rate of reaction due to the fatty acids (the product of the reaction) lowering the pH of the solution closer to lipase' optimum pH.
==> How enzyme concentration must be kept accurate:
We are using different enzyme concentrations in this reaction so even though they are not being kept constant they must be accurate. The source of the lipase enzyme must remain constant due to possibly more or less impurities possibly acting as inhibitors therefore causing anomalies. The sample of lipase must be kept in suitable conditions (example; the same temperature throughout) so as not to cause denaturation of enzymes. Also, the same graduated pipette must be used each time.
- Fat content of milk:
==> What is it:
Triglycerides can be solid or liquid at room temperature. The solids are called fats while the liquids are called oils. Fats are solid due to the high proportion of saturated fatty acids (those with no double bonds).
==> How it affects the reaction:
The fat content of the milk must remain constant throughout all the tests. We will be using the same measures of milk for each experiment, however if the fat concentration of the milk alters, the same measures will contain different amounts of lipid. This will have the opposite effects to changing enzyme concentration in the way that increase in milk lipid concentration will result in a faster rate of reaction up until the point where lipase becomes rate limiting and milk lipid molecules are hugely in excess of the lipase enzyme. In this case, there would simply be too few enzymes to catalyse much of the substrate (milk lipid) at once.
==> How fat content of milk will be kept constant:
To ensure that the fat concentration of milk is kept constant, we will use milk from the same sample. Homogenised milk also must be used. This is milk where the fat is equally distributed throughout. This is different to normal milk as no fat is suspended at the top of the milk, which would mean the concentration would differ with each sample we take. Although homogenised milk is being used it must still be stirred before taking a measurement as a precautionary step to increase accuracy.
- Temperature:
==>How it affects the reaction:
This reaction using enzymes will be greatly affected by differences in temperature if they arise. The temperature will have to be kept constant throughout. The higher the temperature is, the higher the rate of reaction will be up to the enzymes optimum temperature. For lipase this is around 37º ideal for the body's internal temperature also at 37º. Beyond this temperature, the enzyme will begin to get denatured by the heat. What this is, is the change in shape of the enzyme, by altering the specific tertiary structure of the enzyme so the substrate no longer fits the active site and the enzyme is completely useless. This process is irreversible so enzyme cannot be used after becoming denatured. Increasing temperatures up to this point increase the rate of the reaction by giving the enzyme and the substrate increased kinetic energy so they move faster and collisions between enzyme and substrate are more often and also stronger ensuring more successful collisions.
==> How temperature will be kept constant:
The experiment is being carried out at room temperature so everything used in the test will be kept at room temperature before being used. By doing this all tests should be carried out at the same temperatures. It must be insured that samples are not placed next to radiators etc which will cause anomalous results.
- pH (sodium carbonate):
==> What is it:
pH is a measure of the concentration of hydrogen ions in a solution. Acidic solutions contain a high proportion of hydrogen ions and alkaline ...
This is a preview of the whole essay
==> How temperature will be kept constant:
The experiment is being carried out at room temperature so everything used in the test will be kept at room temperature before being used. By doing this all tests should be carried out at the same temperatures. It must be insured that samples are not placed next to radiators etc which will cause anomalous results.
- pH (sodium carbonate):
==> What is it:
pH is a measure of the concentration of hydrogen ions in a solution. Acidic solutions contain a high proportion of hydrogen ions and alkaline solutions contain a much lower proportion. 5cm3 of sodium carbonate is added to raise the pH to roughly pH 10. This is necessary because as the reaction progresses, the solution becomes more acidic due to the production of fatty acids. The increased acidity means that enzymes will begin to denature past roughly pH6. Therefore if we raise the starting pH, more of a significant drop in pH will be observed.
==> How it affects the reaction:
Sodium carbonate has no negative affects on the reaction. It does however produce the alkaline conditions which lipase operates in, in the duodenum.
==> How pH will be kept constant:
The starting pH will be kept constant by ensuring that the same amount of sodium carbonate is added to the solution. Also the same amount of milk and bile must be added to maintain a constant pH. However the pH throughout the test will be different due to the increased amounts of enzyme being used causing a quicker pH change further towards acidic conditions.
Methods of recording results:
There are four main possible ways in which the results could be recorded for this experiment. These are:
) Data Logging
2) pH meters
3) Indicators of pH e.g.: phenolphthalein
4) Universal indicator solution.
The advantages and disadvantages four each one will be discussed before the most suitable is decided.
) Data Logging: Data logging equipment, connected to a computer can be used to record results very well. When connected to a pH meter the data logger can be set to automatically record the results at set intervals e.g.: every 0.1 seconds. Very clear results will be given however there is not enough for the whole class to use at once. Also it lacks the simplicity of using perhaps universal indicator, however is far more accurate.
2) pH meters: These have the advantages of being very accurate, easy to use and will also show precisely how quickly the pH is changing and to what it is changing to. If these are chosen, the reading from the meter can be recorded every 10 seconds or so and put into tables.
3) Phenolphthalein is an acid-base indicator. Acid base indicators can be used in this experiment due to the fact that as the lipid is broken down by the lipase, fatty acids (acidic) will lower the pH of the solution. The way it works is that it changes colour according to the hydrogen ion concentration of the solution that they are added to. Phenolphthalein changes from pink to colourless when the solution goes below about pH9. This colour change is a lot easier for the human eye to detect when the beaker is held in front of a white tile. Other indicators such as methyl orange are more difficult to detect the end point due to the less distinct colour change in. It changes from orange to yellow. Another advantage is that phenolphthalein is readily available for the whole class to use. Disadvantages to phenolphthalein is that although the colour change is easier to detect when compared to others it is sudden and goes from completely colourless to very pink, very quickly.
4) Universal indicator solution, unlike phenolphthalein, is a mixture of several different acid-base indicators. This changes colour through the colours of the spectrum through the individual pHs. Universal indicator goes back down the spectrum of colours when changing from alkaline to acidic. In this experiment as the starting pH will be about 10, the colour of the universal indicator will be blue. The solution will start to become less alkaline and the colours will indicate this by going green (pH 8-9) then yellow (6-7) etc. An advantage to this method is that universal indicator is readily available to be used by the whole class, and it is also relatively accurate.
The chosen method of recording results for preliminary experiment:
For the preliminary experiment I have chosen to use universal indicator. This is because I believe it will be relatively accurate and still easy to carry out. For this to work according to plan, we need to use a scale to which we will base our results on. This scale is shown below.
Preliminary experiment:
There is a need for a preliminary experiment to be carried out. By ensuring one is undertaken the results are likely to be more accurate. The results from the preliminary experiment are likely to show errors which would have only been found out by doing the experiment. This way, after the preliminary, we can design a far more accurate experiment to gain far better results which we can then easily analyse.
Preliminary apparatus:
- Test tubes x5
- Test tube rack x1
- Solutions of --> Lipase enzyme (2cm³ for each test)
--> Homogenised milk (5cm³ for each test)
--> Bile (2cm³ for each test)
--> Sodium carbonate (5cm³ for each test)
--> Universal indicator solution (5 drops for each test)
- Stop watch
- Safety goggles
- Graduated pipette x4 (one for each solution used)
Risk assessment:
There are many risks in this experiment that we are carrying out. It is important to consider them before undertaking the experiment so that not only our results will be more accurate but also so that we are all safe. Firstly, the lipase enzymes which we will be handling are irritants and can cause a lot of damage. Because the majority of the cell membrane is made from lipids, lipase if in contact with the eyes can digest the cell membranes and cause severe damage to eyes. Also if in contact with skin lipase will do the same damage. If lipase does come into contact with skin or eyes, it is important that the area is washed thoroughly with water. To overcome this problem I will ensure I wear protective eyewear and never let lipase become in contact with my skin. An apron must also be worn at all times during the experiment to protect clothing.
Preliminary experiment method:
This experiment will test different concentrations of 5% lipase enzyme solution to see how it digests milk lipid. Each concentration will be tested just once. The lipase concentrations will be 1%, 2%, 3%, 4%, and 5%. The lipase is a 5% solution and it was split into the different concentrations using the following table as a guide. The correct amount of water is simply added to the correct amount of enzyme in a small beaker then stirred before taking the sample for the test. It must be first stirred so the enzyme and water are evenly distributed making the concentration correct.
Desired Enzyme Concentration (%)
Amount of Enzyme (cm³)
Amount of Distilled Water (cm³)
4
2
2
3
3
3
2
4
4
5
5
0
Firstly I will collect 5 test tubes and put them in the racks and label them 1 to 5. I will then add 5cm³ of milk to the ten test tubes using a graduated pipette. One pipette will be allocated to one substance so to ensure no contamination occurs, these pipettes will be individually labelled with its contents name, e.g.; milk for ease of use. Then the 5cm³ of sodium carbonate will be measured and added to each of the five test tubes. Now the universal indicator, 5 drops will be added to the five test tubes. 2cm³ of bile will now be measured and added to the test tube labelled 1, and the stop clock immediately started for two minutes. The milk and bile must be left for the same amount of time for each test so that we know the lipid has been emulsified to the same extent for each test. The lowest concentration of lipase (1%) will then be added to test tube 1 and the stop clock started. Using the scale on the previous page I will record the colours from the table seen at 10 second intervals for up to two minutes. Once the two minutes is up the exact same method will be followed for the other tests using the test tubes labelled 2 to 5 only increasing the enzyme concentration each time.
Before the experiment I will construct a table so I can easily record my results.
Preliminary experiment evaluation:
There were many errors that arose when conducting this preliminary, which I should now be able to eliminate by using my knowledge of them and properly preparing for the final experiment. I initially added the homogenised milk to the 5 test tubes labelled 1 to 5. This is however where the first error arose. I was to use 5cm³ for each test. I filled a 5cm³ graduated pipette up to 4.5cm³ and assumed that the end section would be to the value of 0.5cm³. However it may not have been which was likely to lead to further inaccuracies later on. To overcome this error I would simply fill the pipette up to 5cm³ and release the milk up to the point where the measurements stop, leaving the end section still filled. Secondly to ensure I emptied all of the milk to the test tube I held the tip of the pipette to the side of the test tube. However this releases the milk which remains on the side of the test tube where no lipase is likely to be present after the reaction begins. I will instead lower the pipette down into the solution then straight back up out of the solution. Any left over in the pipette is accounted for in the design of it.
After the 5cm³ of milk, 5cm³ of sodium carbonate, and 5 drops of universal indicator was added followed by 2cm³ of bile to test tube number 1. The emulsification process would have now begun. The stop clock was started and the solution was left for 2 minutes. It is important to ensure that the solutions are left for as close to equal amount of times so that relatively the same amount of fat micelles have been produced through the emulsification process in each test before the reaction has started. This ensures that there is relatively the same surface area of lipid for the lipase molecules to catalyse in each test. This way, after the 2 minutes is finished the lipase will be added, which is when the stop clock is started again, and the colour of the solution is recorded every ten seconds for two minutes. However unexpectedly we found recording the colour change every ten seconds particularly difficult which was more than likely to have caused errors in our results. The colours would never quite match the scale and as the pH change is not massive i.e.; changing from very alkaline to very acidic, we need something more precise to measure the pH to the nearest 0.1. I have instead chosen to use a pH probe which will simply be put into the test tube immediately after the lipase has been added. The reading will then be recorded every ten seconds and plotted in a results table.
During the experiment lipase was collected using a graduated pipette. It was simply taken out of the beaker then added to the test tube. This however did not take into account the fact that lipase settles at the bottom of the solution. This would mean that concentrations would have a varied leading to inaccurate results. Realising this, I have now decided to stir the lipase solution each time before removing a sample from the beaker. This will ensure we achieve a lipase concentration as close to our desired concentration as possible.
After the bile was added to the solution of milk, universal indicator, and sodium carbonate it was just timed for two minutes before adding the lipase. The bile however may not have completely dispersed throughout the solution in some tests and may have in other tests. This will mean that the extent to which the large lipid droplets have been emulsified will differ in many of the tests therefore altering the surface area the lipase can work on. In order to maintain as close to constant surface area I must now gently shake the test tube, which will more evenly disperse the bile. This will also have the affect of increasing the collisions between bile and fat droplets so will in turn increase surface area. However all tests should be affected in the same way so should have relatively equal surface areas.
For the final experiment I have decided it would be best to repeat each test three times equalling 15 tests in total.
Apparatus:
- Test tubes x15
- Test tube rack x2
- Stirring rods x2 (one for lipase, one for homogenised milk)
- Solutions of --> Lipase enzyme (2cm³ for each test)
--> Homogenised milk (5cm³ for each test)
--> Bile (2cm³ for each test)
--> Sodium Carbonate (5cm³ for each test)
--> Buffer solution
- Stop watch
- pH probe and pH meter
- Distilled water
- Safety goggles
- Graduated pipette x4 (one for each solution used)
- Apron
- Marker pen (for markings on test tubes and pipettes.)
- Seven beakers (one for each concentration of lipase, one to hold lipase before being diluted, and one for buffer solution)
Method:
* For safety I will first collect a pair of safety goggles and put them on. I will then put on an apron to prevent any damage to my clothing.
* Next I will collect 15 test tubes and two test tube racks. After putting the tests tubes in the racks I will mark the test tubes 1 to 15 using the marker pen.
* Next I will collect a pH probe and meter, five graduated pipettes, and a stop watch. I will next mark the four pipettes, milk, Sodium Carbonate, Lipase, Distilled water and Bile.
* I will collect the distilled water and the seven beakers and mark them, 1%, 2%, 3%, 4%, and 5%. The sixth will be labelled lipase, the seventh labelled Buffer.
* I will now stir the large beaker full of lipase (used by the whole class) ensuring using that nothing is suspended in the solution. As shown by the table below, 30cm³ of lipase is needed in total so using a graduated pipette I will measure out 5cm³ of 5% lipase solution and put it into the beaker labelled Lipase. I will then repeat this 5 more times each time emptying the contents of the pipette into the Lipase beaker, therefore having 30cm³ in total.
* Using the table below as a guide I will produce the different concentrations of lipase enzyme, each in there own marked beaker.
Desired Enzyme Concentration (%)
Amount of Enzyme (cm³)
Amount of Distilled Water (cm³)
2
8
2
4
6
3
6
4
4
8
2
5
0
0
* From the large class size beaker of homogenised milk, after stirring it with a stirring rod, I will add 5cm³ of homogenised milk to each of the 15 test tubes using the graduated pipette marked milk.
* Next I will add, 2cm³ of sodium carbonate to each of the 15 test tubes, using the graduated pipette labelled sodium carbonate
* I will now pour some buffer solution into the seventh beaker, and then attach the pH probe to the pH meter.
* I will now place the pH probe in the puffer solution and switch the pH meter on. After doing so I will set the meter to pH7.
* I will now measure out the 2cm³ of 1% lipase solution using the graduated pipette labelled lipase and place it on the desk, so that my hands are free to gently shake the test tube during the emulsification process.
* Next to text tube one I will add 2cm³ of bile using the graduated pipette marked bile. The stop clock will now be started immediately after.
* I will gently and constantly shake the test tube to evenly disperse all the contents (most importantly bile) throughout the solution.
* The bile will be kept in for a total of two minutes before adding the 2cm³ of 1% lipase solution.
* As soon as the two minutes are up I will add the measured amount of lipase to test tube 1 and immediately place the pH probe into the test tube.
* After 10 seconds of the lipase being added I will take and record the reading from the pH probe using a table. The reading will continue to be taken every 10 seconds up until another two minutes is up.
* After two minutes of adding the lipase, the final reading will be taken and recorded.
* Next I will remove the pH probe and wash it with distilled water, before placing it back into the buffer solution, to ensure none of the contents remain on it.
* I will now measure out the 2cm³ of lipase 1% again using the graduated pipette marked lipase, and place the pipette and its contents on the desk.
* Next I will measure out 2cm³ of bile again using the same graduated pipette marked bile. I will set the stop clock to zero, and then add the bile and immediately start the stop clock.
* While the bile is emulsifying the large lipid droplets into small fat micelles I will gently and constantly shake the test tube just as I did in the previous test and just as I will in the remaining tests.
* A record of pH will be taken every 10 seconds from the pH meter, up until two minutes is up.
* The exact same process will be carried out as just described for each test.
* After every third test the concentration of lipase used will go up 1%. From 1% to 2% to 3% to 4% and finally to 5%.
* When all 15 tests have been carried out and the results recorded, safety goggles and an apron must still be worn as the same hazards still remain hazards.
* The equipment will be rinsed out, and put away ready to be thoroughly washed.
* The marker pen, pH meter and probe and stop clock will be placed in their correct places at the front desk before the work surface is cleaned.
* Using hand wash, I will now wash my hands to ensure no lipase or bile etc is left on them.
* Now the safety goggles and apron can be removed as no experimental hazards remain.
Results:
pH, taken at 10 second intervals for two minutes after lipase was added.
Enzyme Concentration (%)
0
20
30
40
50
60
70
80
90
00
10
20
9.0
9.0
9.0
9.0
9.0
9.0
9.0
8.9
8.9
8.9
8.9
8.9
9.0
9.1
9.0
9.0
9.0
9.0
9.0
9.0
9.0
8.9
8.9
8.8
9.2
9.0
9.0
9.0
9.0
9.0
9.0
9.0
9.0
8.9
8.9
8.9
2
9.4
9.3
9.3
9.2
9.2
9.2
9.2
9.1
9.1
9.0
8.9
8.9
2
9.4
9.4
9.3
9.3
9.2
9.2
9.1
9.1
9.1
9.1
9.0
8.9
2
9.5
9.4
9.4
9.3
9.3
9.2
9.2
9.1
9.0
9.0
8.8
8.8
3
8.2
8.2
8.1
8.1
8.0
8.4
7.8
7.7
7.7
7.5
7.3
7.1
3
8.3
8.2
8.1
8.0
8.0
7.9
7.8
7.5
7.4
7.3
7.1
7.0
3
8.2
8.2
8.0
8.0
7.9
7.9
7.8
7.7
7.6
7.5
7.3
7.2
4
8.6
8.5
8.5
8.4
8.2
8.1
8.0
7.9
7.7
7.6
7.5
7.4
4
8.6
8.5
8.4
8.3
8.2
8.1
8.0
7.8
7.7
7.7
7.6
7.6
4
8.5
8.5
8.4
8.4
8.2
8.1
8.0
7.8
7.7
7.6
7.5
7.5
5
8.8
8.0
7.9
7.8
7.6
7.5
7.3
7.3
7.2
7.2
7.1
7.1
5
8.0
8.2
8.1
8.0
7.8
7.6
7.6
7.5
7.4
7.3
7.2
7.1
5
8.1
8.1
8.0
7.8
7.7
7.6
7.4
7.3
7.2
7.2
7.1
7.0
pH average from above results of the 10 second intervals for two minutes
Enzyme Concentration (%)
0
20
30
40
50
60
70
80
90
00
10
20
9.1
9.0
9.0
9.0
9.0
9.0
9.0
9.0
9.0
8.9
8.9
8.9
2
9.4
9.4
9.3
9.3
9.2
9.2
9.2
9.1
9.1
9.0
8.9
8.9
3
8.2
8.2
8.1
8.0
8.0
7.9
7.8
7.6
7.6
7.5
7.3
7.1
4
8.6
8.5
8.4
8.2
8.2
8.1
8.0
7.8
7.7
7.6
7.5
7.5
5
8.1
8.1
8.0
7.9
7.7
7.6
7.4
7.4
7.3
7.2
7.1
7.1
Bold: Anomalous result. (Not included in sum to calculate average)
Analysis:
Once the experiments had been completed and results recorded in a rough table, I then drew up a neat table showing all results. Using this table, I then calculated the average values for each time interval at each concentration. This set of results was then put in another table of averages. Using both of the tables I plotted 5 graphs, one for each concentration, showing the pH changes over time. The initial rate of reaction was then worked out for each of the concentrations by drawing a tangent against the steepest part of the curve. The gradient was calculated using the sum: (change in y)/(change in x). This would give the rate of reaction, which was then plotted on a sixth graph, one point for each concentration.
All graphs show the general trend of the pH decreasing as time increases, which is what I expected. However the rate and extent of these do vary considerable as can be seen by the graphs. The lipase enzyme breaks down the milk lipid (triglyceride) into three fatty acid chains and one glycerol molecule. As the name implies, fatty acids are acidic, therefore the more of these produced, the greater the fall in pH. From the graph for 1% lipase solution, it can be seen the drop in average pH is only 0.2, from 9.1 to 8.9. From this you can conclude that, a lot less fatty acids were produced when compared to the 5% graph where a drop from pH 8.1 to 7.1 was observed. This is because in the 5% concentration there was more lipase present in the reaction to digest lipids thus producing more acidic conditions.
I will now discuss the rates of the reactions, and patterns observed in them. Firstly the most important point is that the rates of reaction should have increased as enzyme concentration increased. This is what I predicted and is also backed up by the fact that, the more enzymes there are present and available to catalyse a reaction, the quicker a reaction will take place, simply because of the increased likelihood of a successful collision taking place resulting in three fatty acid chains and a glycerol molecule being produced. In general a trend of positive correlation can be seen from the rate graph, where, in general the rate increases as the enzyme concentration does.
The rate of reaction graph shows that for 5% concentration the rate is slower, although only by 0.00018 pH change per second, than the 4% concentration. Levelling off of the curve can also be noticed, which can be put down do the increasing amounts of enzymes, yet equal amounts of lipid, resulting in the lipid becoming rate limiting, preventing the rate from further increasing. To find out if it is the rate limiting lipids that are causing the levelling off of the curve and not just errors in the experiment, more enzyme concentrations must be tested to see if the rate remains level and does not begin increasing again, however time was a big constraint to us doing this. There are many reasons for the rate not showing to be as high in the 5% graph when compared to the 4% graph. These are all discussed in the evaluation.
Part of my prediction is shown to be correct up to 4% concentration. I said that the rate of reaction will increase as the enzyme concentration does, which did happen. However I said this increase would be in direct proportion to each other. This is, theoretically what should of happened if there were no errors (or inhibitors which get in the way of the active site preventing the substrate from attaching) in the experiment. This can be seen in the five the graphs drawn.
Evaluation:
Overall, I do believe the experiment was carried out to a good level, although problems did occur. The preliminary experiment proved to be vital and many more errors would have occurred without undertaking a proper preliminary. My method, in the plan, proved to be clear and easy to follow, which too reduced errors in the experiment because it was necessary for me to think thoroughly about how things should be undertaken. I believe my plan was good, however some errors did arise as can be seen from the graphs, tables, and as described in the analysis. Some of these errors were controllable, and some were not.
There are many potential errors in this experiment of which some or all could have affected my results in some way. It is possible that these errors could cancel each other out, however in this case, I believe that not to be the case. Below are some errors in order of the extent that I believe they affected the reaction. Firstly, after each test, the pH probe was placed in buffer solution and reset to pH7. Buffer is a solution which can absorb hydrogen ions, resulting in the pH of a solution containing buffer hardly changing if acids (fatty acids, a rate measuring product of this reaction) are added to it. When the probe is taken out of he buffer solution, in order for the pH change of the test to take place and to be measured without being affected by the buffer still on the pH probe it must be washed off with distilled water. However in many cases this may not have taken place simply because of it slipping my mind. This would result in the same reaction still taking place, without as much of a pH change being detected by the probe because some of the hydrogen ions (produced by the reaction) being absorbed by the buffer still on the probe. I must pay special attention to this factor if carrying out the experiment again as it can have a big affect on the results.
The temperature of the room we were in would have slightly varied throughout the experiment. As we know, enzymes are greatly affected by temperature, which increases or decreases there kinetic energy, increasing or decreasing the strength and frequency of collisions. Also, the experiment was not carried out all in one go, and two lessons on two different days were used. This increases the extent to which temperature could have affected this experiment as the temperature difference on the two different days is likely to be great. One day could have just been hotter than the other, or on one day the radiators could have been on while on the other day they may not have been on. Also, these reactions are exothermic (energy given out as heat), thus the heat given out from one will warm the surrounding air and increase the temperature for the next reaction which takes place there therefore increasing the rate. The temperature was not monitored at all, which would be my first suggested improvement. As well as monitoring the temperature, precautions must be taken to keep it constant, for example, using a water bath, kept at a constant temperature.
Another potential error, which I believe was a factor in my experiment was, incorrect measurements being taken. Due to me having my attention on the stop clock, while shaking the bile, then having to measure out the lipase in time to add it, I may not have always correctly measured out the right amount. This would result in more or less enzymes thus altering the rate of reaction, and a change in the overall shape of the curve. To overcome this problem if I was to repeat this experiment, firstly more attention must be taken when measuring, however due to the need to be close to exactly on time it may not be possible. A better solution would be to use more accurate measuring equipment such as electronic pipettes which would be much more precise than the human alternative.
All solutions I that were used e.g. bile and lipase, were stirred thoroughly before being measured out and added to my experiment. This was to ensure that all the lipase and bile salts etc were equally distributed throughout their solutions, so that concentrations were kept constant. However, it is possible that even stirring the solutions would not results in a constant concentration throughout the solution. This would results in more or less enzymes, or bile salts in the reaction thus speeding or slowing down the rate. To overcome this problem, an electric mixer could be used to slowly and constantly mix all solutions throughout the experiments duration, so lipase for example will never settle at the bottom of the beaker. By having an electrical devise to do a job which was previously done by me, I would be able to spend more time on reducing other aspects of possible human error in the experiment.
Lastly, the accuracy of my timing is also a factor which too must be considered to be a potential error causing inaccuracies in results. Readings from the pH probe should have been taken every 10 seconds, however they may in a lot of cases been taken at 9 seconds or 11 seconds, which is enough time difference for the pH to have changed, therefore making some of my results inaccurate. To overcome this problem of human error, data logging equipment could be used and by connecting it to the pH probe, it can automatically record exact readings at exact time intervals (smaller than every 10 seconds to get a clearer picture of the pH change), resulting in the problem of timing being completely ruled out. However data logging equipment is likely to not be available for the whole class to use, so a much smaller class would be needed.
To conclude, I believe the experiment was carried out well and to the best of my ability. The results were not as good as predicted however still show the general trend I was hoping for. This experiment shows just how important enzyme concentration can be when breaking down lipids in the body. If too low, lipids will not be broken down fast enough, so it is essential it is kept just right in the body.
Bibliography:
==>Biology 1 ------------- Mary Jones, Richard Fosbery, Dennis Taylor
==>Advanced Biology ------------- CJ Clegg, DG Mackean
==>mrothery.co.uk ------------- Mark Rothery
==>Chemistry In Context ------------- Graham Hill, John Holman