Method
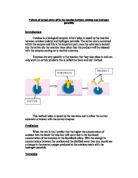
For this experiment, the same amount of yeast was placed in the same volume of different concentrations of hydrogen peroxide. The volume of oxygen given off was measured in a measuring cylinder and recorded.
The apparatus was set up as shown in diagram 1.
For each of the runs of the experiment the following steps were taken:
- If the level of water in the measuring cylinder was not at zero, the level it was at was recorded.
- As the yeast was added, the bung connected to the delivery tube was put in the top of the boiling tube and the stop clock was started.
- The clock was stopped after 30 seconds and the level of water at that time was recorded.
- The difference between the starting level and the final level was calculated giving the volume of oxygen released as the catalase breaks down the hydrogen peroxide.
- The air temperature was measured and recorded for each reading. This stayed constant throughout the experiment.
The first reading was with distilled water, as it has the concentration of 0 Vol hydrogen peroxide. 10ml of the solution was measured in a syringe and put into a boiling tube. 2ml of yeast was measured in a different syringe and added into the boiling tube. The experiment was started as stated above and the results were recorded after 30 seconds.
The next reading was taken with 2.5 Vol hydrogen peroxide solution. This solution consisting of 5ml of 5 Vol solution mixed with 5ml of distilled water, was added into the boiling tube and then 2ml of yeast added. The experiment was carried out as above and the results recorded.
The experiment was repeated for 5, 10, 15 and 20 Vol solutions of hydrogen peroxide. These results were recorded.
The experiment was repeated 3 times with each concentration and an average volume calculated.
Changes made after the preliminary experiment
In the preliminary experiment, potato pieces and yeast suspension were put into hydrogen peroxide of concentration of 2.5 Vol and then the number of oxygen bubbles given off were counted. This was done to find out for what time the experiment should be done for and also to ensure that good readings could be taken with the lowest concentration of hydrogen peroxide. Also, from this it was possible to work out whether to use potato or yeast.
In this preliminary, 1 and 5 discs of potato were used and 2ml of yeast was also tested. This was done with 15ml of 2.5 Vol hydrogen peroxide solution.
The time was set to 30 seconds and with only 2ml of yeast. Any time over 30 seconds meant that too much oxygen was given off to measure and if the time was less then there would not be enough to produce accurate results.
As the hydrogen peroxide is broken down, water is formed so the solution becomes diluted and therefore the concentration of hydrogen peroxide drops. This effect becomes greater as the amount of time the experiment runs for increases. For this reason, the length of the experiment has to be kept relatively short to keep the concentration as constant as possible. This is also the reason why 10ml of hydrogen peroxide solution was used.
Yeast was chosen because it is easier to keep the amount of catalase constant because it is hard to cut potato to exactly the right size whereas it is more accurate to measure out the volume of yeast suspension. Also, when using potato, the volume of oxygen produced was too small to produce accurate measurements.
Preliminary results
This table shows the results for using discs of potato in 2.5 Vol hydrogen peroxide solution and the number of bubbles in each minute.
This table shows the results for 2ml of yeast solution with 2.5 Vol hydrogen peroxide solution and the number of bubbles in each 30 second period.
Fair test
This experiment was done with only 2 changing variables:
- The concentration of the hydrogen peroxide solution
- The volume of oxygen
The independent variable is the concentration and the dependent variable is the volume of oxygen. In order to make it a fair test, all other possible variables had to be kept the same for each experiment. These were:
- The temperature – measured and recorded
- The volume of hydrogen peroxide solution – 10ml
- The same measuring cylinder to measure the volume of oxygen
- The volume of yeast solution - 2ml
- Different syringe for each different solution, either of hydrogen peroxide or yeast
- The hydrogen peroxide solutions were made from the same water
The temperature was kept as stable as possible by keeping the beakers out of sunlight so they could not heat up. It would have been better to keep them in a water bath to keep the temperature constant. However, the ambient temperature did not change over the period of the experiment.
If there was a small amount of hydrogen peroxide solution, as the hydrogen peroxide gets split up into water and oxygen, the solution gets less concentrated, but if there was a large amount, then this effect would be negligible. To ensure that the dilution effect is the same for each experiment, the volume has to be kept the same for each experiment.
Different measuring cylinders give slightly different measurements, so to reduce the chance of an anomalous result the same measuring cylinder was used for each experiment.
The same volume of yeast was used for each experiment because this keeps the amount of catalase equal in each experiment. If more was used then more oxygen would be given off because there would be more catalase to break down the hydrogen peroxide If less was used then less oxygen would be given off because there would be less catalase.
The hydrogen peroxide solutions were made from the same water so they all contained the same amount of impurities to begin with. For this experiment distilled water was used as it is pure.
Safety
Lab coats were worn so as not to damage or stain clothing with the yeast or hydrogen peroxide. Care was taken when using the hydrogen peroxide because it is an irritant and is dangerous if it goes in a person’s eye. Therefore, goggles were worn to prevent this. Nothing was be spilt on the floor. It is necessary to be careful because the floor could become slippery and potentially dangerous.
Results
Temperature = 21°C
This table shows the results for the all 3 runs of the experiment and an average. All the results are similar across the row as would be expected.
Analysis
Graph 2 shows the average volume of oxygen produced against the concentration of hydrogen peroxide. The graph has a strong, positive correlation of points and the volume of oxygen produced is proportional to the concentration of hydrogen peroxide. The best fit line does not go through the origin but cuts the X axis very close to it. This could either be because of inaccuracies of the experiment or that at small concentrations, the probability of a molecule of hydrogen peroxide is so small that it is effectively zero. There are no anomalous results in this experiment although for 15 Vol hydrogen peroxide solution, it is hard to tell which side of 41 the average should be or whether it is exactly 41. Looking at the graph, it would appear that the average should be lower than 41 to fit into the best fit line better. The results fitted with my prediction as long as the graph is the first part of the prediction graph, before it starts to flatten out. To find out if it does flatten off, higher concentrations of hydrogen peroxide have to be used.
Conclusion
From the results you can see that as the concentration of hydrogen peroxide increases, the volume of oxygen produced increases. This shows that the higher the concentration and therefore the more molecules of hydrogen peroxide, the more collisions occur between the active site of the catalase and the molecules. This means that more hydrogen peroxide is broken down so therefore more oxygen is formed. The experiment does not support my prediction that at a certain point, the line of the graph will flatten out and this is where all the active sites are busy with hydrogen peroxide molecules at the same time. The only way to tell is to test high concentrations of hydrogen peroxide as well and then plot those points on the graph. The result does support my prediction up to a point. The graph shows a straight line and the beginning of the prediction graph also shows a straight line before curving and flattening off. This could just be the beginning of that line.
Evaluation
This experiment was not very accurate. As mentioned in the fair test section, the temperature was not kept the same and this could have affected the volume of oxygen given off. A water bath could be used to keep a constant temperature in the boiling tube. However, it was recorded and the temperature did not change during the experiment.
The measuring of the volume of hydrogen peroxide solution was not extremely accurate because the scale on the side of the syringe was probably not very accurate. This is the same for the syringe for the yeast.
For the higher concentrations, for example 20 Vol hydrogen peroxide solution, the volume of oxygen was hard to measure accurately because of the high rate of oxygen production and also because the measuring cylinder only had markings every 5ml so it was not very accurate.
However, the results are reliable because the results were recorded properly and all 3 tests produced similar results. The graph did not show what I predicted as it did not flatten off but the volume of oxygen produced did increase proportionally to the concentration of hydrogen peroxide. I think that the results did not match the prediction because of the various inaccuracies in the experiment but also because the range of hydrogen peroxide concentrations was quite small. It could be the first part of the predicted graph and 40, 50 and 60 Vol solutions might show the full extent of the graph.
Relevant further work
To find out whether my prediction was correct, other hydrogen peroxide concentrations could be tested. For example, 40, 50 and 60 Vol solutions could be tried and the results would be expected to produce a curve on a graph.
The effect that temperature has on the reaction can be investigated. The catalase will get denatured at a particular temperature so that can be worked out.
It is possible to find out at what point the diluting effect of the hydrogen peroxide being broken up in the water and oxygen has an effect at a certain concentration. To find this out, the experiment would be run through as normal but record what volume of oxygen is produced every 5 seconds for 5 minutes. Doing this it is possible to find out if the 30 seconds used in this experiment was affected by the dilution from the breaking up of hydrogen peroxide by the catalase.