³ Salters-Nuffield Advanced Biology for Edexcel A2 Biology
Planning
Hypothesis: There will be a significant relationship between percentage cover of Birch and light intensity.
Prediction: I predict that there will be a greater percentage cover of Birch in the 2008 coupe due to a greater light intensity compared to the older coupe which was coppiced in 2004, where the light intensity is not as great. This is because there are more trees in the older coupe which blocks light from reaching the Betulaceae seedlings.
Null Hypothesis: There will be no significant relationship between percentage cover of Birch and light intensity.
Sampling
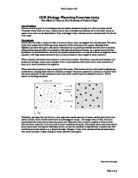
The type of sampling that I will use for my investigation will be very important because it will have a significant affect on the results I collect. The method of sampling will be random, this could be done in a number of ways but the process I will undertake will be to use the last two numbers of a phone number from the contact list in my mobile. The reason I have chosen to do random sampling is because it will be more representative of the area, strictly because each sector has an equal chance of being selected for investigation.
It would be possible for me to select a different type of sampling such as systematic sampling however the reason why I cannot choose this is because I would not be able to use a belt transect to investigate along a gradient.
Within the 10x10m grid the first number can represent the x-axis and the second the y-axis. I have chosen to work in this particularly sized area because it will provide me with enough space and it is not too large an area. It is convenient because of the fact that the numbers will always be between 0-9. I am also using a quadrat; this will be integral to my investigation especially as I will be placing this piece of equipment on the co-ordinates I have chosen. The quadrat will be used to help me estimate the percentage cover of the Betulaceae.
In order for me to get a guide of how many results I should do, I will calculate a running mean which was basically the cumulative result of the percentage cover of Betulaceae. If the value stabilises then it would show that there are enough results for me to collect, I will ensure that enough evidence is gained in order to help prove my hypothesis is correct.
Pilot Study
Field Study Method
- I will draw up a results table to record all the necessary results I collect. I will have to select an area where I can work comfortably, without any distractions such as large bushes or trees. It would also be in my best interest to choose an area that consists of the plant species, Betulaceae.
- Create a 10x10m grid using to tape measurers; this would be the area I will use to carry out my investigation.
- The sampling method will be random; I will choose co-ordinates by using the birthdays of random colleagues.
- I would use an ungridded 50x50cm quadrat to measure the percentage cover; I will make sure that I drop it on the co-ordinates selected.
- I will then record the different variables within that quadrat such as the temperature, light intensity, wind speed, soil temperature and humidity with all the individual equipment required.
- The soil thermometer should be put in first because it takes a relatively long time to process a reading, I will leave it for approximately 2 minutes.
- The lux meter will record the light intensity and on the instrument it has three different settings, the setting I put it on will depend entirely on the strength of intensity of the light. I will most likely use the x100 in a recently coppiced area whereas in an area that has not been coppiced I will put it on the x1 setting.
-
I will calculate the running mean, this will act as an indicator for the number of samples that I will need to record. The more times I repeat the procedure the more likely I will improve the reliability and validity with my quantitative data and qualitative analysis. The running mean must be at least +/- 2.5 and once this has been approached I must double the total number of samples planned.
-
I will write down all off the results I have obtained in the results table.
Equipment
-
Anemometer - This is a device that will enable me to record the speed of the wind.
-
Lux Meter - This instrument will be used to measure the light intensity of the environment.
-
Thermo Hygrometer - This instrument will measure both the temperature and the humidity of the environment, this is essential as they are both key variables.
-
Soil Thermometer- This instrument will be used to measure the soil temperature of the soil and this is also an important variable due to its link to temperature and its indirect link to light intensity.
-
Tape Measurer – I will use a tape measurer to measure out a 10x10m grid, the area I will be working in.
-
Ungridded 0.5m square frame Quadrat - Using this instrument I will measure the percentage cover of Birch.
-
Hand Trowel - I would need to use a hand trowel to collect soil samples which would be required to calculate the soil pH and moisture level.
-
Soil Auger - This piece of equipment will be used to drill deeper into the soil in order to collect a sample of bottom soil. I will later test the pH in the laboratory.
-
Sealable Plastic Bags – I will use plastic bags to collect the soil samples I have obtained, they will be used for further examination in order to calculate soil pH and moisture level.
Variables
There will be many variables that will influence the information I will obtain from my experiment, some will be controllable but most will be uncontrollable. Uncontrollable variables that I am likely to encounter would be the wind speed, temperature, humidity, soil temperature, soil pH and light intensity. I will record the measurements of each of these variables in order for me to compare my results and make them more valid. There may also be concerns over the accuracy of my results; especially regarding the percentage cover of the Birch, the reason for this is because I must give an estimated percentage according to a 50x50cm quadrat. For the reason that I have just explained I believe it will be important for me to use the same equipment consistently, this will ensure that any error that may occur will be a systematic error.
Independent Variable
The independent variable is the most important variable, simply because I will be looking to find out whether it has a direct link to the percentage cover of Birch or not. The light intensity is the independent variable and I will measure using a lux meter.
Dependent Variable
The dependent variable will be dependent on the results of the independent variable and this is the percentage cover of Birch.
Control Variables: Abiotic Factors
The abiotic factors are non- living, they must be kept the same but this is not possible because they are uncontrollable variables.
- Wind speed: The wind is an uncontrollable variable; its measurements will vary at different periods and places. I will have to use the same equipment to measure it so that I will be able to keep any systematic errors the same.
- Temperature: the temperature of the environment will not remain the same; it will change constantly and will continue to use the same equipment.
- Soil temperature: the soil temperature will also be different, it cannot be controlled but it will not fluctuate as often as other variables.
- Humidity: The humidity of the environment will not be the same and will also change quite frequently when I measure it.
- Soil pH: The pH of soil is unlikely to undergo dramatic changes; they are all mostly acidic so they will be controlled to a certain extent.
- Light intensity: the light intensity will change the most frequently of all the variables, this is because it depends on the sun and light travels the quickest so the changes will be seen much quicker. The light intensity is also my independent variable; I will also measure this variable.
Possibly the only way I would be able to control all these variables is by working in the same area, where these variables are likely to be most similar. This could be easily done because of the 10x10m grid I have chosen to work in, and I will carry out the investigation using random sampling.
Variables: Biotic Factors
The other plants surrounding the Birch may have a much greater influence; this is because they will be competing with one another for nutrients, light, oxygen and space. This will undoubtedly affect the Birch’s resources and limit their growth rate. Biotic factors that will exist within the plant species will be disease and parasites; this can be very dangerous and could wipe out an entire species. There could also be predators of birch such as animals that can eat them.
Risk Assessment
This risk assessment identifies the hazards that may occur during my field study experiment. I have used a system that will help recognise the severity of each of the hazards; some will be more severe than others. The likelihood of occurrence and severity will be given a rating between 1 and 3.
- Frequent 1- Minor
- Few times 2- Harmful
- Rarely 3- Near Death
The outcome rating will be calculated by multiplying the likelihood of occurrence rating by the severity rating.
For each of the hazards I have shown the precautions that should be taken in order to keep harm to a minimum, after I take this into consideration I will then calculate the new perceived outcome rating of each hazard. It has been advised by my tutor that any hazard which receives a rating between 4 and 9 should be reassessed.
Pilot Study
It is imperative that I carry out a pilot study before I do my actual investigation, this will give me a good indicator for what I should expect from the actual investigation. I will be able to learn from any flaws and look at any improvements that can be made towards the planning of my investigation; I will know all the techniques and be familiar with the equipment. I will be able to gain more experience prior to my proper investigation, meaning I would become more naturally familiar with the plant species, the equipment and areas where I’d be working.
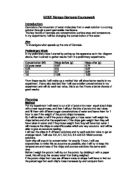
Results: Pilot Study
2004
2008
Ethical Considerations
During my investigation there may be ethical issues which I will have to take into consideration, it is important to acknowledge them because they may be a result of negative and damaging behaviour towards the environment.
There will be concerns in the manner that I carried out my investigation, for example when I walked around I trampled on many plants and this inevitably caused great damage. I used an auger to dig soil from the inner depths of the ground and this obviously destroys the structure of the soil whilst also ruin the roots of plants.
When I used the soil thermometer I had to pierce it through the ground and this meaning that it worked in the same way as the auger but was less damaging. These acts have all had a negative affect on the plants growth and the environment that they live in, they have been categorised as ethical because they have disturbed the plant species in some particular way.
Evaluation of Pilot Study results
The pilot study did what I intended it to do; it helped me gain more experience, working in these conditions and showed me any flaws that were in the method I was using. It went very well, I collected enough results to give me an indicator for what to expect in my actual investigation.
My results have informed me that in the 2008 coupe I am more likely to come across Betulaceae using random sampling than in the 2004 coupe. The independent variable which is the light intensity is highest in the 2008 coupe, combined with the fact that there was more Betulaceae in that coupe as well it can be suggest that it supports the theory that Birch is light tolerant.
The temperatures of the 2008 coupe were also higher than that of the 2004 coupe, this is again due to the exposure from sunlight, this is when the sunlight emits UV radiation and rebounds from the Earth to convert itself into infrared radiation.
During the actual pilot study the weather was very hot but I made sure I put sun cream; exactly how my risk assessment had informed me. At first it was difficult to identify the Betulaceae but I used an identification sheet to make it easier for me. The equipment I used was sufficiently good and I will continue to use it in my final investigation.
The light intensity of the coupe was very low compared to the 2008 coupe, in a few of my results the percentage cover it showed that when I found the Betulaceae via random sampling were very high, this is because they have grown much larger but there were much fewer in numbers.
Amendments
In my pilot study I used an ungridded 50x50cm quadrat; I have decided to change this to a gridded 50x50cm quadrat. The reason for this is because it is more accurate; as there are no squares in the quadrat it will be more difficult to estimate the percentage cover of the Betulaceae. The gridded quadrat shows that 1 square represents 4% and within that 1 square, 4 small squares represent 1%. I have concluded that the remainder of my method is of a good standard and there is no need to amend any of it.
Observing and Recording
Results of Investigation
2004
Average Light intensity: 53916.6
Average Birch percentage cover: 14.4
2008
Average Light intensity: 7841
Average Birch percentage cover: 21.9
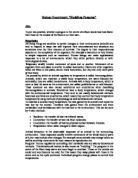
The T-test
Light intensity of both the 2004 and 2008 Coupe ⁴
⁴ Knowledge from T-test calculations originally derives from, http://www.biology.ed.ac.uk/research/groups/jdeacon/statistics/tress4a.html
Statistics
I have chosen to do the t-test statistics, the reason for this is because I will be finding a significant difference in between the two coupe that I am investigating. I am going to need to compare the means of two sets of data. The t-test takes into account the degree of overlap between two sets of data and allows you to say how certain you are in saying that the means are, or are not significantly different from each other. In other words the t-test is very detailed and accurate and is a very good method if I want to prove my hypothesis is correct.
Analysis of statistics
The results of my t-test show that the standard deviation value of the Birch is very insignificant, this tells me that there is no apparent significant difference between the two coupes for the percentage cover of Birch for 2004 and 2008. It was 0.82; the 4.55 value is very significant his was the standard deviation for the light intensity of both the 2004 and 2008 coupes. This has meant that my hypothesis has been proved wrong and my null hypothesis is correct.
Evaluation of results
The results that I collected show that the percentage cover of Birch is low in the 2004 coupe compared to the 2008 coupe, the main reason for this could be the fact that in the 2004 coupe the light intensity is lower than in the 2008 coupe. There are a few anomalies in the 2004 results that I collected, the explanation for most of them is that there was less biodiversity and there were very few Birch there, in fact it was difficult to come across them and when I did the percentage cover was very high because they were fully grown.
In the 2008 coupe I had noticed that for many of the percentage cover of Birch results I had found that the individual results that were high also had high variables, for example, my 13th sample had the percentage cover of Birch was 29% and the temperature was 19.4 Celsius. This could show that when there is a high temperature there is also a high percentage cover of Birch.
Conclusion of results
The results prove my hypothesis wrong however this is from the statistics that I have done and it is clear that they do not represent any significant difference. The null hypothesis is correct as there is no significant difference, the limitations of my results were, the time and the failure of some equipment. There was a lack of time to complete some results this may have affected the results I had taken for my 2004 coupe. Ways in which this could be rectified is by working faster or leaving earlier.