In this experiment there is an independent variable, which is referred to as e, this is the extension of the spring and the dependent variable is the distance the cart moves up the ramp form its stretched position, it is referred to as d. The independent variable is the factor which is not varied and the dependent variable is the factor that varies according to the independent variable, hence their names. In order to analyse the results in a detailed and scientific way I intend to use two equations that will produce relevant results to support my conclusion. The first one is the formula for elastic energy:
The other equation works out the gravitational potential energy (h is the difference in height):
During the experiment a string of energy changes take place, which are:
In this experiment 1/2, k, m and g are all constant. Taking this into account h = (constant) e2. However, d is measure rather than h in this case and as the angle of the slope is kept constant d must be proportional to e2. I am now able to predict the following:
Prediction:
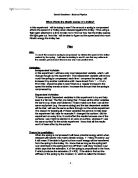
I predict that the distance the spring is stretched form the non-stretched position will be directly proportional to the squared figure of the distance the cart moves up the ramp, i.e. d/e2, where d = the distance the cart moves up the ramp and e is the distance the spring is stretched from a resting position, will equal the same figure for each reading taken as the figures should be directly proportional. This should therefore record a graph as shown below.
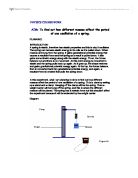
Apparatus:
The apparatus shown below should be used in the experiment:
Diagram:
Observations
We carried out the experiment as explained in the method above. We took down the results that we achieved from the experiment and they are listed in the table of results below.
Table of Results:
We had to make sure that all detail was taken into account to carry out the experiment. Firstly when I was measuring how far the cart had moved up the ramp I attached an accurate meter rule to the ramp and put my eyes inline with the ramp to see exactly where the cart had reached on the ramp. I also made sure all measurements were as accurate as possible so I used a protractor to measure the angle between the bench and the ramp, which measured as 10o, as well as this I used an accurate ruler to measure the distance form the top of the ramp to the bench. I also measured the mass of the cart on scales, which was 830g and the elastic constant of the spring measured was 15.2N/m.
Analysis:
I carried out the experiment as explained in the method. As shown in the data recorded in the graph above there is definitely a trend. This is that greater the extension of the spring, the further the cart travels up the ramp. The best fit line on the graph is acquires a strong, positive, linear correlation. The line of best fit shows that there is almost a direct correlation between the y- and x- axis. This means that the relationship between the distance the spring is extended and the distance the cart moves up the ramp are directly proportional, where an increase in one means an equal increase in the other. This is also shown in the table below in the added shaded column entitled “d/e2”, where all the results are very close to 0.08. All these results are as I predicted in the planning section of this coursework. The idea that the d is directly proportional to e2 can be shown scientifically by using formulas that were quoted before.
Assuming that there is 100% efficiency between the changes form elastic energy to gravitational potential energy we should obtain the following:
This scientific theory greatly suggests that d is directly proportional to e2. However, during this experiment we can not expect 100% efficiency, as energy is lost to all different areas such as, the air and due t friction.
However, although the line of best fit goes through most of the points on the graph this does not mean that I can make a firm conclusion at this point. The main results that I am concerned with are the two that are circled in red on the graph and are shaded in dark grey on the table of results below. This problem could be the consequence of not carrying out some of the procedures correctly for that results, or that there might have been a small bump on the ramp at that point.
In the graph above there is one point that is circled, this is an anomalous result as it does not fit perfectly in line with the line of best fit so there must be something that was done wrong in order for this to have happened.
Evaluation:
I found that in general the experiment went well and I found out a lot of important information, which will help me create a firm conclusion. This shows that the experiment was worthwhile for me so that I can find out information about energy in springs. The procedure was relatively easy and quick to carry out so it made it hard to make any mistakes. The line is a non linear strong positive correlation graph, meaning that the line is not straight, all most all the points come close to the best-fit line and the line starts at zero and goes upwards.
For our purposes the accuracy of the results appear good enough to produce a best-fit line that has a correlation. There are two results that could be classified as “anomalous” these results are circled in red on the graph above. The results, however, do not stop me making a firm conclusion from my results obtained from the experiment.
The procedure was suitable as explained in the analysis, however, there are some improvements that could be made to influence better results and are much stronger positive correlation graph. Firstly, when I was carrying out the experiment I found that it was hard to see where the cart had reached when it was travelling up the ramp, so in fact it could have been that the speed of the cart was too quick and I was not able to see the extra few millimetres that the car might have taken. In order to improve this I could have put paint on the wheels and where the paints stops would have told me where the cart had stopped, I could have also used some ticker tape and a timer attach to the cart to find out the exact distance the cart had moved, this would be the distance between the first and last dot on the ticker tape.
Secondly, I found that in two of the goes I found that the cart did not go in a straight line and I was therefore the cart would have travelled further as I only measured as the crow flies. This is because if the cart did not go in a straight line it would have travelled further than it would have it had travelled in a straight line. I could have improved this by making a track so that the cart could only move in one direction and therefore it would only go in a straight line.
It would also be helpful to carry out further investigations to learn more about the energy of a cart moving up a ramp. There are several ways in which I could do this. Firstly I could change the angle of elevation between the ramp and the bench, this would mean that the cart would travel further or less far depending if the angle was increased or decrease. Secondly, I could have increased the range of pulling back the cart, so I could have gone further than 30cm and I could have also taken a reading for e every 2cm rather than every 5cm. Thirdly, I could have use a different spring, either made of a different material (e.g. wood), a different width, a different length or even a different elastic constant. This would show me how the gravitational potential differs with differing springs. Swapping the dependent and independent variables around could be another way of finding out further information about the energy of a spring, i.e. the dependent would be the distance the cart moves up the ramp and the independent variable would be the distance the spring in extended. I could also change the mass of the cart by adding weights or taking away some weight form the cart to see if this would affect the results. It might also be that the temperature and pressure of the room in which the experiment was carried out in might have affected the results we obtained, as the wheels might have expanded or contracted.
Overall I think that the results I obtained from this experiment are precise enough for me to justify a conclusion. This is because the line of best fit goes through most of the point on the graph and that the two anomalous results are clearly anomalous and not that I drew the wrong line of best fit. I can firmly say that the graph possesses a very strong correlation line.