Prediction: The four factors that helps collision theory are:
- Concentration (A non dilute solution; has a lot of particles)
- Catalyst (A type of enzyme which helps speed up a reaction)
- Size of particles (The surface area of a partcle)
- Temperature (At a high temperture it speed up a reaction)
I predict that as the temperature is increased the rate of reaction will increase. This means that the graph drawn up in my analysis will have positive correlation, and will probably be curved as the increase in rate of reaction will not be exactly the same as the temperature is increased. This can be justified by relating to the collision theory. When the temperature is increased the particles will have more energy and thus move faster. Therefore they will collide more often and with more energy. Particles with more energy are more likely to overcome the activation energy barrier to reaction and thus react successfully. If solutions of reacting particles are made more concentrated there are more particles per unit volume. Collisions between reacting particles are therefore more likely to occur. All this can be understood better with full understanding of the collision theory itself:
For a reaction to occur particles have to collide with each other. Only a small percent result in a reaction. This is due to the energy barrier to overcome. Only particles with enough energy to overcome the barrier will react after colliding. The minimum energy that a particle must have to overcome the barrier is called the activation energy. The size of this activation energy is different for different reactions. If the frequency of collisions is increased the rate of reaction will increase. However the percent of successful collisions remains the same. An increase in the frequency of collisions can be achieved by increasing the concentration, pressure, or surface area.
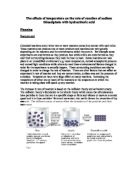
Apparatus:
- Hydrochloric Acid
- Sodium Thiosulphate
- 2 measuring cylinders
- 2 test tubes
- Thermometer
- Stopclock
- Conical flask
- Lab coat
- 2 beakers
- Piece of paper with a black cross on it
- Ice
- Test tube rack
- Water bath
Method:
1. Put lab coat on.
2. Retain your equipment.
3. Get 2 beakers; fill one up with Sodium Thiosulphate and fill the other one with Hydrochloric Acid.
4. Measure 103 of each of them using separate measuring cylinders.
5. Put the solution into separate test tubes.
6. Get the conical flask ready with the piece of paper, with the cross on it, at the bottom of it.
7. Put the solution in it and start the stopclock.
8. Stop the stopclock when the cross on the paper is no longer visible.
9. Record how many seconds it took.
10. Do the same procedures but heat or cool them using the water bath or ice to the temperature you desire.
Safety: A pair of goggles will be worn during the heating part of the experiment in order to protect the eyes. An apron will also be worn to protect the skin and clothing. When handling hot beakers and measuring cylinders a pair of tongs will be used. A gauze and heatproof mat will be used while heating to avoid any damage to the equipment.
Fair Test: In order for my findings to be valid the experiment must be a fair one. I will use the same standard each time for judging when the X has disappeared. I will make sure that the measuring cylinders for the HCl and Thiosulphate will not be mixed up. The amount of HCl will be the same each time, and the amount of Thiosulphate will be the same also. During the heating stage of the experiment, a blue flame will be used throughout. Also the same Bunsen burner and gas tap will be used to maintain continuity. All of these precautions will make my final results more reliable and keep anomalies at a minimum so this will make the entire investigation more successful.
Table:
Analysis: In this experiment I have found that as the temperature is increased the time taken for the reaction to take place decreases. This means the rate of reaction increases as it takes less time for a reaction to take place, so more takes place per second. In the temperature experiment the time taken for a reaction to take place decreased by roughly 10 to 15 seconds for every 10¦C increase in temperature, with the one anomaly being the 30¦C reading. There is also a trend in the increase in rate of reaction as the temperature increases.
Using the graph, with lines of best fit, I can draw a conclusion from my experiment. The graph for the temperature experiment has a steep curve meaning that the decrease in time taken for the reaction was rapid.
Naturally, the above means that the graph plotting the rate against temperature has a positive correlation as the temperature is increased so does the rate of reaction. This is because when the temperature is increased the particles will have more energy and will move faster.
Conclusion: My prediction was right because of the evidence on my graph and table. I had a few mishaps throughout my journey but I overcame them. This experiment took place for about two weeks and coming to the end I was getting a bit frustrated and bothered but I dealt with it. I think my experiment was successful because I have a good insight on the rates of reaction now.