A key part of my experiment relies on whether on not the denaturising of the enzymes is reversible, so I decided to set up a series of quick experiments to find this out:
-
I mixed ½cm3 of 4% Tripsin and ½cm3 of pH 3 buffer in a test tube, placed this in the 43oC water bath, and waited for ninety seconds.
- I then attached a thin, 5mm by 35mm piece of film to a clean wooden stick, and put this in the solution.
-
I found that after six minutes, the film had not gone clear, so I then added 1cm3 of pH 10 buffer, and then took a test to find the exact pH. This was pH 7.
- I then started timing (as soon as I had put in the pH 10 buffer). Every twenty seconds, I stopped the timer, took out the film, and held it against a pencil cross to see if it had gone clear.
It took 100 seconds for the film to go clear, and this shows that pH denaturation is reversible. At first I found this hard to believe so I repeated the experiment and got the same result. This suggests some things about the type of denaturation that goes on, but I will talk about this in my analysis.
-
I then mixed 1cm3 of 2% Tripsin and 1cm3 of pH 8 in a test tube, and put this in a 90oC water bath.
- When the solution had reached the desired temperature, I put a piece of film (as above) in the solution, and started the timer.
- I stopped the timer and took the film out to check if it had gone clear every twenty seconds, but it soon became apparent that it was not going to go transparent.
-
After six minutes, I took the test tube out of the water bath and put it into the 33oC water bath.
- I then continued the process of checking the film every twenty seconds, but it never went transparent.
This means that temperature denaturation is not reversible, and this has some important consequences for my experiment; it means that the incubation period is very important, because presumably if temperature denaturation is irreversible, then the longer you leave a solution at a temperature where there is significant denaturation, the more of the enzymes would be denatured.
I also needed to find out more minor details, such as how long it took to warm a solution up to the temperature of the water bath, so that it would be at the right temperature when I set up some rough experiments to find the optimum temperature. I used a buffer of pH 8, and a 2% solution of Tripsin, in a one to one ratio. Thus, the solution was only 1% of Tripsin. Then I placed it in the hottest water bath (there were many of these at temperatures ranging from room temperature to 90oC), and put a thermometer in the solution, and started timing. When the solution reached within a few degrees of the temperature of the water bath, I stopped timing, and recorded that it had taken ninety seconds for the 2cm3 solution to increase from room temperature to 90oC. This would be the time that I would leave each solution in the bath for, before I put in the strip of film. I realised that this would have an effect on the results, because for every second that I left the solution at that high temperature, the enzymes would be being denatured. Therefore, I will have to keep the incubation period exactly the same for every experiment. However, this is still not very satisfactory because leaving it at 90oC for a minute would have a vastly different effect on the enzymes than leaving it at 30oC for a minute. However, this should not have too great an effect on the experiment because if the enzymes were denaturing that fast, the film would probably never go transparent. Equally, at low temperatures, enzyme denaturation over only a minute would be minimal. However, at temperatures just above the optimum temperature, where the enzymes are denaturing, but not so fast that there is no reaction, then the incubation period, or time the test tube is left in the bath, is very important. This is because of the fact that temperature denaturation is irreversible, so the longer the solution is in the bath, the more the enzymes would be denatured. Therefore, in different temperatures, the incubation period would have different effects, and the only way I could make sure that the amount that the Tripsin had been denatured was constant for each temperature would be to add the solid Tripsin to the water at the temperature that I was investigating, (or to spend hours doing complicated experiments to find how fast the enzymes denatured at that temperature, and then to decide on the incubation period for each temperature). Unfortunately, I didn’t have the recourses to be able to do this for each experiment, so I decided that it would be much simpler to vary only the pH because I couldn’t accurately determine the exact concentration of undenatured Tripsin at the time when I put the piece of film into the test tube. If the temperature is constant, then I would not have this problem, and my earlier experiments have shown that pH denaturation is reversible, so the incubation period would have no effect.
One more problem is that I have no evidence that enables me to make a quantitative prediction about my results. Therefore, I set up an experiment with catalase, the enzyme which catalyses the decomposition of hydrogen peroxide. Although this is very different from Tripsin, it may still provide me with some useful information on which I could base a quantitative prediction.
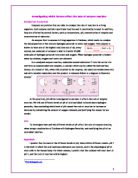
I set up seven burettes, and into each one, I put 10cm3 of hydrogen peroxide. Next, I added 5cm3 of buffer of pH 4 to 9 into each burette (pH 4 into one, 5 into the next etc). Then I added 2cm3 of catalase, extracted from potatoes into each burette, and turned each one upside down, and back up twice. Over the next few minutes, bubbles began to form on the surface of the liquid in the burette, and because of the size of the burette, they stayed and began to build up. Two minutes after the experiment had begun, I recorded how many centimetres of bubbles had formed in each burette, assuming that this was a direct indicator of enzyme activity. I got the following results:
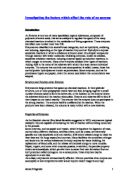
A graph to show the height of the bubbles produced by the decomposition of hydrogen peroxide when catalysed by catalase, at different pHs
This graph shows that the optimum pH for catalase is just above seven, but that is not really what I’m interested in. In order to get some useful information for the experiment with Tripsin, I will have to look at the way that the graph declines as you go away from the optimum temperature. If I assume that 7 is the optimum pH, then I can say that the rate at 7 is 100%, and put all the other rates as a percent of the rate at pH 7. I have displayed these percentages in the table above.
Therefore, I could expect, that if Tripsin behaves like catalase, I could expect a 20-30% decrease as you move 1 pH from the optimum. Then I would expect a decrease of around 90% at 3 pH points from the optimum, but it is hard to be exact, because while I expected a symmetrical curve, and therefore would expect the rate for pH 9 to be similar to that for pH 5, they are very different. I could take an average of the two results, for 2 pH points from the optimum, but that would give equal validity to each result. If you look at the graph, the point for pH 9 does not fit on the general curve, and seems as if it could be wrong. Also, I would expect the rate for 9 to be much lower than the rate for pH 8, which it is not. Finally, I would expect the rate for a pH 3 points from the optimum to be very small, at around 2% of the optimum rate.
However, this theory is not perfect because it relies on the assumption that Tripsin does behave like catalase, which frankly is not that likely because they are very different enzymes.
Other than this, I predict that the graph of rate against pH will be a bell-shaped curve, with its peak at around pH 8
Apparatus
Test tubes
Water bath – this will be used to heat the solution in the test tube, and maintain a constant temperature.
Syringe with measurements on the side. This will be for measuring the solutions out into the test tube.
Beaker – for keeping the solutions in before I use them.
Thermometer
Chemicals
Tripsin dissolved in water in 2% and 4% solutions.
Buffer of pH 3 to 10
Saturated salt solution
Method
Safety – If you get any Tripsin in your eyes wash it out and seek assistance immediately. It can hydrolyse the protein of your cornea.
-
I mixed 1cm3 of 2% Tripsin and 1cm3 of pH 3 buffer in a test tube, placed this in the 51oC water bath, and waited for ninety seconds.
- I then attached a thin, 5mm by 35mm piece of film to a clean spill, and when the ninety seconds was up, I put this in the test tube, and started the stop clock.
- After 10 seconds, I stopped the clock, took out the piece of film, and checked if it has gone transparent by holding it against a black cross on a piece of paper.
- Then I repeated this process of checking if the film has gone clear every ten seconds until it went transparent. It did not gone clear after six minutes, so I recorded this on the results sheet as more than six minutes. I made sure throughout the experiment that I did exactly the same thing each time I took out the film.
- I then mixed up more test tubes replacing the pH 3 buffer with pH 4, then 5, 6, 7, 8, 9 and 10, and carried out the experiments with each different pH
- I found that I could conduct two or more experiments at once, without losing any significant amount of accuracy, and so decided that in the given time it would be better to do the each experiment twice, while doing two or three experiments at once.
- After one experiment, I noticed that the result was very different to what I expected, and the result I had got in a previous experiment with similar conditions, so I repeated it.
When I had completed this set of experiments, and was confident of the accuracy of my results, I still had some time to investigate further into the workings of the enzymes so I decided to explore the effects of ions other than those found in the acid or alkali. Therefore, I decided to test what would happen if I added salt to the solutions, and see if these ions interfered in any way with the enzyme-substrate bonding.
I mixed 1cm3 of saturated salt solution with 0.5cm3 of pH8 buffer, and 0.5cm3 of 4% Tripsin solution, so that I had a 1% solution of Tripsin. I also mixed a test tube with 1cm3 of pH8 buffer, and 1cm3 of 2% Tripsin solution, and placed both of these in the 51oC water bath, and carried out the experiment as above, taking car to do exactly the same thing to each test tube. The results (see below) surprised me at first, so I repeated the experiment, and took a pH test to check that the pH was the same in both test tubes. I then concluded that these were probably accurate results, and will analyse them when the time comes.
Results
Temperature: 51oC
Concentration: 1%
pH Time taken/seconds Rate (1/
1st Reading 2nd Reading 3rd Reading Average (excluding average time)
anomalies)
= Anomalous
pH 8
Temperature: 51oC
Concentration: 1%
Time taken for film to go transparent/seconds
1st reading 2nd Reading 3rd Reading Average
Analysis
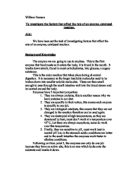
The problem with this graph (above) is that it doesn’t dhow the rate of activity, only the time taken. The rate can be found by dividing 1 by the time taken, so inverting the graph. This is shown below:
A graph to show the rate of enzyme activity in different pHs
I stated in my prediction that I expected the rate to decrease by a certain percentage as you go away from the optimum pH. This table below shows the percentage of the optimum rate.
Discussion
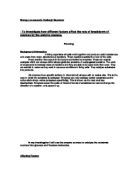
The graph shown above (enzyme activity) shows the roughly bell shaped curve that I would have expected from a graph of pH against enzyme activity. This is because its optimum pH is where the concentration of hydrogen ions is such that they interfere in the enzyme-substrate binding positively, and they do not twist or misshape the enzyme, particularly the active site. In other words, the hydrogen ions, or in this case the hydroxide ions that are present in the solution must be in a concentration that neither breaks the hydrogen bonds that hold the enzyme molecule in its shape, nor interferes with the active site, by sticking to the active site or the substrate.
Enzyme denaturation as you go further from the optimum pH is symmetrical. This means that the graph should be symmetrical, which it is very close to being. The thing that differs between my results, and the graphs in the textbook is the steepness of the bell curve. My results suggest that there is still a significant amount of enzyme activity 3 pH points away from the optimum. PH is a logarithmic scale (each pH point change means a ten fold change in ion concentration), so this means that the enzymes are still working when the ion concentration is 1000 times different from the optimum.
The rate decreases on either side of the optimum pH by around 30% for each point on the pH scale that you go down. This is surprising that the rate decreases so steadily and may be because Tripsin is a very stable enzyme, and is not denatured much by changes in pH. As the pH becomes more acid, the amount by which the rate decreases increases, but on the other side of the optimum temperature, the decrease in rate, decreases. This I must put down to experimental error, because the graph should be symmetrical, and the amount that the rate decreases by, should increase as you move further form the optimum because of the fact that the pH scale is logarithmic.
My quantitative prediction based on the catalase experiment, is fairly similar to the results that I got. The table shows the predicted percentage of the optimum temperature next to the actual percentage of the optimum. For pH 7-9, my prediction is very good, with the percentages very similar. However, at pH 6 and 10, i.e. 2pH points from the optimum, the prediction is much less good. I predicted that the rate would be around 10% of the optimum rate, but it is still around 50 %. This trend of the actual rate being much higher than my predicted rate continues, so that where I predicted that there would be only about 2% of the optimum rate at 3 pH points from the optimum, there was actually around 30%.
Conclusion
Therefore, my prediction, that the graph would be bell-shaped seems to be mostly correct. The fact that this bell shaped curve is much shallower than I had expected suggests that Tripsin is not easily denatured by pH variations, and so that the hydrogen bonds that hold the enzyme molecule in shape are stronger in Tripsin than in catalase. I was pleased to find that the graph showing the rate against pH was close to a symmetrical curve, because as I said above, I found that this was what the curve should roughly look like in a text book. However, one factor about the curve that suggests to me that something is wrong is that the curve isn’t very curvy. If it were a curve, then there would be an increase in the amount by which the rate decreases, but on my graph the rate decreases by around 25% of the original each pH point you move away from the optimum, and this rate of decrease remains constant, suggesting a straight line. This is odd, because my experiment with catalase produced results that formed a bell shaped curve. Part of the problem may lies with the fact that I was only measuring the time to the nearest 10 seconds, so many of my results could have been slightly different. This is magnified by the fact that I did the experiment at a relatively high temperature, so the process would have been happening so fast that it was hard to be accurate, and even if I was accurate to the nearest 10 seconds, this is still a huge percentage error (ranging from 17% down to 6%). Another factor that may have caused inaccuracies that could lead to the graph being the wrong shape is that the way that I measured the rate. I put a piece of film in a solution of Tripsin and waited for this to go see through. If it never went see through, then I assumed that there was no enzyme activity at all, but this may not have been true, and there may have been some activity, just not enough to hydrolyse enough of the gelatine, and so make the front layer of the film fall off, so that the film goes see through. Once I have taken these factors into account, I begin to realise that my results are not perfectly accurate, and so that the shape of the curve is not as definite as the line I have drawn on. In fact, it is perfectly possible that the results would fit a curve, but each one is out by a little. Therefore, when I came to drawing the line of best fit, I was aware that each point might have been out by a little, so the line of best fit is curved, and does not go through all the points. Therefore, my results are not the same as those I got in the catalase experiment, but this is because the enzymes Tripsin and catalase are very different, so that not only are their optimum pH’s different, but the width (the number of pH points from the optimum that it takes for the rate to decrease by 90%) of their curves is different. Therefore, trypsin must be a more stable molecule than catalase. Its optimum pH is 8. For each pH point that you move away form the optimum pH, the rate decreases by around 30% of the optimum rate.
Salt Solution Experiment
My secondary experiment, in which I investigated the effect of adding salt to a solution of trypsin is more interesting, and useful in showing that ions interfere with the binding, and this is not always in a negative way. I expected that adding the salt solution would mean the sodium and the chlorine ions would interfere in a negative way with the bonding between the enzyme and the substrate, and also break the weak hydrogen bonds that give the molecule its shape. However, my results show that this is not the case at all. The salt solution means that the trypsin hydrolysis the gelatine faster than it would without, even when the pH is close to optimal. This suggests some important things about the effect of ions on the solution. Sodium atoms and chlorine atoms are of fairly similar size, but when ionic, sodium ions are smaller. This suggests that perhaps these are having a greater effect (I am basing this on the fact that hydrogen ions have a much greater influence than any others because they are smaller), but I am not sure. I know that the enzyme works best when there is a relatively low concentration of hydroxide ions. These are negatively charged, and bigger than hydrogen ions, in fact, I assume that they are a little smaller than a chloride ion, but again this is an educated guess. The solution in which I carried out the experiment would have been about half the concentration of a saturated solution. The fact that the rate increased with the salt solution suggests that the ions helped in the enzyme-substrate bonding in some way, and did not affect the hydrogen bonds. These results show that not only hydrogen and hydroxide ions can interfere with the enzyme.
Sources Of Error
As I have said above, the experiment is not perfect. There was an inaccuracy when I measured out the solution. I estimate that I measured each part of each solution to the nearest ml, so when I measured out the 1cm3 of Tripsin solution, I was accurate to ±1ml, this also goes for the buffer, so that what I thought was a 1 to 1 mix solution of 2 % Tripsin, and pH 8 buffer, so a 1% solution, the ratio was actually somewhere between 0.9: 2 and 1.1: 2, so the concentration was between 0.9% and 1.1%. This is a margin of error of 10%. This is very high, and means that my results are only accurate to a maximum of 90%. Another source of error was that I was only able to check if the film had gone transparent every ten seconds. This means that I can only say that the piece of film went clear between two times, ten seconds apart. For the shorter experiments (60 seconds), ten seconds could be as much as 17% of the time taken. This is another source for a huge error, and means that the overall accuracy of the experiment is now a maximum of about 75%. I am assuming that the temperature of the water bath was constant to a level of accuracy that wouldn’t affect the experiment, but this may not be the case. However, I have no data for the change of rate as a result of a change in temperature, not do I know how much the water baths may have changed. What I do know is that the water baths are designed to run in a negative feedback loop, so that the heater comes on when the temperature changes drops 1oC below the set temperature. Therefore, the temperature would fluctuate very slightly within the 1oC range, so I think I can take the influence of the fluctuations in the temperature as negligible. Another problem could occur if the buffer was not at the exact pH that it said on the bottle, however, I think I can assume that the chemicals I am provided with are accurate to a level that would mean that error would be negligible in the type of experiments I carried out. I also tested the pH of the solutions, to check that they were at the right pH, and they always were. There also may have been a problem with the fact that many of the spills that I used had already been used for similar experiments before, so may have had some trypsin left on them. I tried to avoid this by using only the cleanest looking spills, and choosing ones that looked similar, but I could never know if there was a significant amount of trypsin on the spill, and if it was going into solution, and affecting the hydrolysis. I cannot turn this possible error into a quantitative margin for error, but I can say that I think that it is unlikely that it affected the experiment in any major way. Therefore, I think that my results were about 75% accurate in theory, but in practice, all of my repeats for the time taken for the film to go transparent were within 12% of the original reading. However, once I have taken into account that 90 seconds could mean 81 or 90, the repeats are only all within 22% of the original. I think that with this level of accuracy it is possible to support my conclusion, to a certain level, but it Is not perfect, and if I could repeat the experiment, I would look to improve this level of accuracy, so that I would be accurate to under 10% and so be more sure about making conclusions. However, I am happy to say that my results do support my conclusion. There was one anomaly, which I highlighted and repeated so that I could exclude it from my graph. I think this may have been due to an error that I made when measuring the trypsin solution out.
Further Work
As I have said above, if I were to repeat the experiment, I would try to improve the overall accuracy. I would do this by using a more accurate method for measuring the solutions, such as with a glass pipette. I would also try to find a way so that I could check on the film more frequently than every ten seconds. If I took it out every five seconds, then I would be faced with the problem that I would have to take the film out of the water up to twenty times, and so might introduce another error. I think that the best way would be to conduct the experiment in a transparent water bath, so that I could continually monitor the film without taking it out of the bath. If glass water baths have not been invented by the time I come to repeat this experiment, I could set up some sort of hi-tech solution, such as an underwater video camera, which would allow me to watch the piece of film in technicolour, as it is slowly hydrolysed away, and so record the exact time at which it goes transparent. This would cut the margin of error from 10 seconds to around 1.
I would be interested to investigate the effects of adding salt solution, when the buffer is at different pHs. I would repeat the experiments that got me the results about the effects of salt solution on the rate, but instead of using pH 8 buffer, I would try other pHs. This would give me data about the combined effects of pH and salt solution, and so would help me to understand the effects of salt solution further, especially if I could compare the results of different pHs with and without salt solution. I do not think that all pHs would be affected in the same way.
Toole and Toole Understanding Biology
Advanced Biology by W R Pickering
Toole and Toole – Understanding Biology