100°c. I have chosen these temperatures as they begin at a low
temperature and end at a very high temperature. The other 3
temperatures are in between. A range of 5 temperatures helps
to show a trend on the graph and it also helps to spot the optimum
temperature. These should give different results. The experiment was replicated four times to spot anomalous results. It helps you to calculate the mean. Replicating increases reliability.
METHOD
Apparatus: Spotting tile
: 5cm³ syringe
: 1% starch suspension
: 0.1% amylase solution
: Stop clock
: Water bath
: Iodine solution
Method:
- One drop of iodine solution was placed in each depression
of the spotting tile.
- 2cm³ of 1% starch suspension was drawn into a syringe.
Air bubbles were removed to ensure that the amount of
starch suspension was exact.
- The syringe is then placed in the waterbath which is
filled with water of the desired temperature. This
removes excess starch from the outside of the syringe.
This is necessary because if there is starch on the
syringe, it will ruin the experiment as the starch will
have reacted with the amylase too soon.
- Measure 2cm³ of 0.1% amylase solution into the
syringe. Total volume in syringe was 4cm³. As this was done, the stop clock was started. The contents of the syringe were quickly mixed. (This was when the reaction began.) One drop was dropped into the first depression of the spotting tile IMMEDIATLEY!
- At 30 second intervals, one drop of the mixture was dropped into each successive depression in the spotting tile. It is good
to use 30 second intervals because this is a rapid reaction so
a time of 30 seconds allows us to tell when the reaction has
ended. The shorter the time interval the more accurately you
can pinpoint the end of the reaction.
- The colours in the spotting tile were observed and where
there was no further colour change, the time was noted.
A dark brown colour was seen at the start as there was more
starch and this became lighter changing to an orange/yellow colour as there was less starch.
The experiment was replicated four times making only one change,
the temperature to spot anomalous results. It helps you to calculate
the mean. Replicating increases reliability.
SAFETY
While carrying out this experiment you must wear safety glasses
at all times. You must take care while using the waterbath as its
temperature can become quite hot.
INTERPRETATION
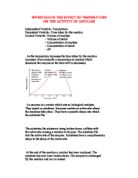
The results were plotted in graphical form of mean time
taken for the reaction (seconds) against temperature (°C).
The graph is ‘u’ shaped, curved at the bottom. You can see
that as the temperature increases, the time taken for the reaction
decreases. The lowest point on the curve shows the optimum
temperature, 40°c.
At the lowest temperature, 25°c, the time was quite long,
300 seconds. At the highest temperature, 55°c, the temperature
was also quite long. The shortest time, appeared to be around
150°c which was at 40°c. This indicated that 40°c was the
optimum temperature.
The results agree with the predictions as I previously said
that as the temperature increases the time taken for the reaction
increases. But eventually a temperature is reached which
denatures the enzyme so the time will be decreased.
I discovered after looking at my results, that the optimum
temperature is 40°c. You can tell this as it is the lowest point
plotted. As the temperature increases the time taken for the reaction
increases. But eventually a temperature is reached which
denatures the enzyme so the time will be decreased.
An enzyme is a protein which acts as biological catalysts.
They speed up reactions. Enzymes contain an active site where
the reactions take place. They have a specific shape into which
the substrate fits. In this case the enzyme is amylase.
The substrate, the substance being broken down, collides with the active site causing a reaction to happen. The substrate fits into the active site of the enzyme. Substrates have a complimentary shape to the shape of the active site. The substrate I used was
starch.
At the end of the reaction a product had been produced. The substrate has now been broken down. The enzyme is unchanged
By the reaction and can be reused. The amylase had broken down
the starch giving a product, maltose.
Sources of error:
1) Time delay before first sample.
2) Drop size of iodine is different.
3) Water bath temperature-may vary a few degrees up or
down. Also temperature change when out of water
bath, rinsing and handling.
4) Drop size of starch/amylase mixture.
5) Inaccurate volumes due to air bubbles.
6) Deciding when the colour change has occurred which
indicates the end of the reaction.
The results should be reliable as a total of 5 replicates were
carried out and the minimum was 3.
Improvements:
1) Another person should start the stop clock.
2) Use a measured volume of iodine.
3) Place apparatus in water bath throughout the experiment.
4) Use a measured volume.
5) Remove air bubbles.
6) Use a spectrophotometer (measures colour change).
If these improvements were made, the reliability would
be increased.
There were a number of anomalous results.
ie 45°c-120 secs
40°c-210 secs
Anomalous results exist because often the end of the
reaction is misjudged.