Osmosis in Potato Chips
Background Knowledge
Osmosis is the movement of liquid a solution into another through a membrane that separates them. Osmosis is essential for the survival of living things. For example, a plant absorbs most of its water by means of osmosis. In animals, osmosis helps regulate the flow of water between body fluids and cells. Osmosis also has many industrial uses, such as water purification and food preservation.
The process of osmosis. A mixture of substances that cannot be separated is called a solution. A liquid solution consists of a dissolved substance called a solute and a liquid called a solvent. During osmosis, some of the solvent from one solution moves through a membrane into another solution. The membrane is semi - permeable which allows some substances, but not others, to pass through. The solvent moves between the solutions depending upon the number of the molecules of the solute and the temperature and pressure of each solution. In common osmosis, the solvent moves into the solution that contains more solute molecules.
Further information on potato plant cells:
Plant cells always have a strong cell wall surrounding them. When they take up water by osmosis they start to swell, but the cell wall prevents them from bursting. Plant cells become “turgid” when they are put in dilute solutions. Turgid means swollen and hard. The pressure inside the cell rises and eventually the internal pressure of the cell is so high that no more water can enter the cell. This liquid or hydrostatic pressure works against osmosis. Turgidity is very important to plants because this is what makes the green parts of the plant "stand up" into the sunlight. When plant cells are placed in concentrated sugar solutions they lose water by osmosis and they become “flaccid.” This is the exact opposite of "turgid". The contents of the potato cells shrinks and pulls away from the cell wall. These cells are said to be plasmolysed. When plant cells are placed in a solution that has exactly the same osmotic strength as the cells they are in a state between turgidity and flaccidity. We call this incipient plasmolysis. "Incipient" means, "about to be".
Preliminary results:
From these results you can see the basic trends for instance the percentage change in mass decreases, as the sugar solution is greater and the length increases when the concentration of sugar solution decreases. These are the trends I will be looking out for in my final results and I will seeing if there are any anomalies in my results which don’t follow the patterns of these results. In my preliminary results I found out its also better to cover the top of the test tubes with some foil so that the solution does not get contaminated and I will be doing this throughout my final experiments.
Other Observation:
The potatoes were firm and I chose two potatoes of approximately the same stature. The solution covered the whole of the potato chips with a centimetre difference between the top of the potato chip and the top of the solution. After 24 hours the solution was slightly misty but still transparent.
Obtaining the Evidence Sector:
Method which was used:
- I took two average sized potatoes and checked that they were both roughly the same size and were firm.
- Using a standard kitchen knife I peeled the potatoes.
- With a scalpel and ruler I cut the potato into “chips” which were 8cm long. I had to be very careful whilst cutting the potato as the scalpel is extremely sharp. I then had 5 chips.
- Taking a test tube rack I placed 5 test tubes on it and then labelled them labelled the test tubes 0.000 Molar, 0.1250 molar, 0.250 molar, 0.500 molar, and 1.000 molar
- Using a measuring cylinder I measured out different amounts of sucrose solution and distilled water, which I then poured into the test tubes in a percentage ratio giving me the various molar concentrations below you can see the table.
- I then weighed every potato chip on an electronic balance and recorded the weights.
- I rapidly placed 1 potato chips into each beaker and left the chips for 24 hours.
-
Before recording my results I set out some paper towels with which I was going to dry the potatoes with and I drew up a basic table for my results.
- After the time period was up I drained out the solutions of the test tubes in the sink and placed all the chips on the paper towel. In the order that I had placed them in the test tubes in order not to confuse myself as to which chip come from which solution.
- I dried each chip with the paper towel and then placed each one on the scales so that I could weigh them.
- Each potato chip was measured accurately on the electronic scales in grams and then the weights were recorded in a table. I also measured the length of each chip using a ruler and this was also recorded in a table.
- As I had time after doing the first set of results I redid the experiment under exactly the same conditions. This gave me many results, which gave me a more accurate view on the osmotic changes on the potato cells.
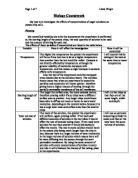
Precautions which were taken:
- I had to enable that all the non-variables remained the same in order to get the fairest possible results and therefore to get the best possible results for my investigation.
- When I had to cut the potato into 8cm chips I had to be extremely careful as I was instructed that the scalpel was very sharp and could easily cause an injury if it was misused.
- When I was placing the various concentrations of the solution into the test tube I had to be extremely precise in order that I didn’t put too much or to less into the test tubes and the right quantity of water and sucrose were placed into the test tubes.
- When handling the potatoes I had to be very careful and make sure my hands were clean and dry so that there was no contamination and I didn’t pass on any excess water to the potatoes.
Table of results:
All results are shown are rounded off to 2.dp.
The percentage change in length (or mass) is worked out by:
Length (or mass) after - Length (or mass) before = X
X / length before (or mass before) = Y
Y x 100 = % percentage change
1st attempt:
2nd Attempt:
3rd Attempt:
4th Attempt:
5th Attempt:
6th Attempt:
7th Attempt:
Calculating the mean for each solution:
Analysing and considering the evidence sector:
In this part of my investigation I will be drawing a line graph with two lines showing the average percentage change of length and mass for the varying molar solutions. Finally I will be analysing the evidence using detailed knowledge and understanding to explain a conclusion which I have drawn from the evidence. I will also explain to what extent my conclusion has supported the prediction that I had previously made.
Analysis:
The line graph shows the percentage gain or loss in mass and length for potato cells in varying concentrations of sucrose solution over a period of 24 hours. The graph curves downwards in both length and mass and both lines do not go through their origin this is because the line is not straight. From this graph we can see that the percentage gain or loss in both mass and length is not directly proportional to the concentration.
I can clearly see a pattern on my graph and this is that as the concentration of the sucrose solution increases the percentage in mass or length decreases. This pattern shows that the percentage increase or decrease of the length or mass is inversely proportional to the concentration.
There is a change in gradient on my graph as the line gets steeper as the X-axis broadens. This maybe because the potato cells are continually becoming more flaccid and therefore the change in length and mass for each molar solution is coming closer together. The line of best fit on my graph show that the results were proven to be reliable as the points marked on the graph are very close to producing a smooth curve.
The graph proves that potato cells increase in mass and length in high water concentrations and decrease in length and mass in highly concentrated sugar solutions.
The line begins to curve at the stronger solutions on my graph this may suggest that the potato cell is coming lose to be fully plasmolysed and soon there will be no further water loss.
On my graph I have marked the isotonic points with a circle and these are estimated at approximately 1.60molar for the mass and for the length. The isotonic point is where the cell is not increasing or decreasing in size and is known to be in a state of equilibrium. At this point no osmosis is being taken place as both the potato cell and the solution have equal molar concentration. The following point at 0.250 molar, shows the length to be around
-3.88% and the mass at -1.83% this indicates that the water potential of the sugar solution in the test tube is weaker than that of the potato chip. The next, 0.500 M, looses approximately 7.18% in length and 3.03% in mass. This shows that the salt solution has even weaker water potential than 0.25 M and that osmosis has taken place. This is why the potato cells has lost even more mass, and it shows that the water potential in the test tubes is less than that of the potato chip. This pattern then continues on through the graph, and even more mass is lost and the height of he chips decreases further, as more water moves out of the potato cell into the solution. The only points in the whole graph to have an increase are the length and the mass points at 0.000 molar concentration and the mass at 0.125 molar concentration. This is because water potential of the sugar solution is less than that of the potato chip and it follows osmosis as osmosis is the passage of water molecules from a weaker solution into a stronger solution through a partially permeable membrane. This form of osmosis enables the chip to increase in mass and length in the 0.000 molar case.
My hypothesis proved to be correct, as I believed that the lower the concentration of the sugar solution in the test tubes the larger the mass of the potato will be and the taller the potato cells will be. This was proven to be correct in my results and the reasoning behind this was because the water molecules pass from a high concentration, i.e. in the water itself, to a low concentration, i.e. in the potato chip. Therefore, the chips in higher water concentrations will have a larger mass and a greater height than in higher sugar concentrations such as 1molar of sugar solution.
Evaluation:
I feel that the investigation was reasonably successful as I did achieve many accurate results because my line graph nearly produced a straight line and it had appropriate correlation and I feel I had an appropriate amount of results to make a suitable graph and informative comments on. I believe that the time period of 24 hours that I used to see the effects on osmosis for the potato cells was a fair time period for osmosis to occur. If a too long a time period was used bacteria may have affected the cells and a too shorter period would not have let full osmosis to take place. I do believe though that I could have possibly varied the time periods so that I could see the effects of osmosis on various time scales if I had a greater time to do the investigation this is a possible area which I could have developed on. I could have perhaps had some potato cells of one concentration in the test tube for an hour and another for a day and the second for three days and so on. In order to give a greater sample and see the effects of osmosis in varying concentrations at different time scales.
I also believe that I had a satisfactory amount of various concentration but again I feel that if I had more time I would have used more concentrations such as 0.20 molar, 1.25 molar, 1.50 molar etc. I believe adding greater molar concentrations would have enabled me to gain far more precise isotonic points for both length and mass change.
I found it especially difficult to cut the potatoes and manage to cut out a potato chip using the cork borer. An alternative solution would be to find a machine that would cut the chips for me and give me exact same weights and heights of each chip because the weights of my chips varied. If I was to repeat the investigation given more time I would try and find a machine that did this as it would enable me to have fairer tests and it would gain me time so I could record even more results. I also feel that the chips could have been measured to a more accurate scale perhaps using the weight in grams to four decimal places rather than two.
I also found it quite arduous to measure out the molar concentrations to an exact amount. I feel an alternative to having placing the molar concentrations by a measuring cylinder would be using a burette, as this would enable me to obtain precise measurements.
I was reasonably happy with the results that I obtained, as I believed that there were no major anomalies. I do believe though there were some close to becoming anomalies this could possibly been down to human fault. An example of a close anomalous result is the percentage change for 1.000 molar concentration length as in my results I got -10.5% but according to my line of best-fit -9.60% should have been the result I should have achieved. This could be because when the potato chips were removed from the test tubes and dried I may well have dried some potatoes more thoroughly than others may have been so the excess water may have contributed to the gain in length and mass. If I had more time to do the investigation I could have possibly found a resource that could have enabled the cells to be dried in the same way and the same time so this would contribute to a fairer test.
On a whole I fell the investigation was successful and I was especially pleased with the positive outcome of my results with no major anomalies occurring.
By Mohammud Malik