There is, however, a slight complication to this general rule. It is stated in the Advanced Biology text book III that a scientist – Koshland – proposed that the active centre of some enzymes “…is changed when a substrate molecule binds to such enzymes.” Thus allowing a substrate that shouldn’t normally fir according to the ‘lock and key’ analogy to fit into an active site when entering. This is called the induced fit mechanism.
After taking into account information discussed previously I can draw the prediction that as the temperature increases the rate of reaction will increase also. True up to a certain point where the enzyme has denatured.
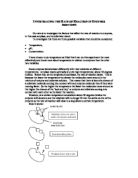
Graphically it could look like this:
To carry out this experiment and investigate the rate of reaction I will test a sample taken at regular intervals on iodine solution, which detects the presence or absence of starch. When there is no starch left this will indicate that the reaction is complete.
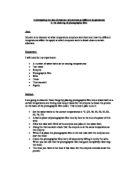
Below is a list of the apparatus I require to carry out this experiment:
- 12 test tubes,
- 18cm3 amylase solution in a beaker,
- 18cm3 starch solution in a beaker,
- heatproof mat, tripod & gauze, Bunsen burner,
- beaker of water (water bath),
- thermometer,
- distilled water in beaker,
- cavity observation tile,
- pipette,
- test tube rack,
- iodine solution,
- timer/stop clock,
- crayon (to mark beakers),
In this experiment we need to ensure maximum accuracy and reliability. To do this we need to ensure there is only one variable. In my experiment it will be temperature. Also, I will repeat the experiment twice and take the averages to ensure the most accurate results. During my main experiment I will also conduct a control as part of my experiment to ensure that the reaction that takes place is catalysed only by the amylase and nothing else. However, to check that my method works as expected I will conduct a preliminary experiment following the same method but without repeats.
The method I will use for the preliminary experiment is as follows. I will also use the same method, if everything goes to plan in the preliminary, in the main experiment.
I will take 3cm3 of amylase solution and of starch solution and heat it them in separate test tubes in a water bath to the desired temperature, or cool if necessary. When they are at the same temperature (according to thermometers in each test tube) I will mix them and start the timer. At the very start and then every thirty seconds after that I will take a sample of the mixture and place it in a depression in a cavity tile containing iodine. Seeing as how iodine indicates the presence of starch; when the reaction is complete the colour of the mixture in the depression should be normal (orange). Until then it should be darker, showing the presence of starch (which decreases as it is broken down by the amylase). I will record the colour of each sample (every 30 secs.) for each temperature experiment. I have decided that to make this investigation reliable and to have a decent set of results to analyse at the end that I should take five sets of different temperature results.
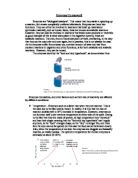
The diagrams below show how I plan to conduct my experiment in relation to the apparatus listed previously.
The following table displays the results obtained from the preliminary experiment.
To get a better impression of what the results mean I have plotted them on a graph:
The graph shows an obvious negative correlation when a line of best fit is drawn. This means that the higher the temperature the faster the reaction took to finish.
I decided not to take more than one reading for each temperature because all I needed was a rough idea of whether or not my method worked.
From these results you can’t tell where or if the enzyme denatures. This is because the temperature range I used didn’t go up quite high enough, so in the main experiment I will have a temperature range that includes a higher top temperature to try and discern when the enzyme denatures. I will also take a wider temperature range.
Seeing as how this preliminary experiment worked well, looking at the results I obtained, I will use this same method for the main experiment, repeating each experiment reading twice.
The results I obtained from the main part of the experiment are shown below:
These results are merely observations and are so far of little mathematical use. To effectively analyse these results, first I have to take the average time that each tube took to finish reacting. For example, to find the average time tube 1 (25ºC) took to finish reacting I have to take the three experiment time readings (4mins, 3.5mins and 3.5mins) add them together and divide by 3 and convert the time into seconds to make it easier to display and handle. Thus:
What has been found out here is the amount of time taken for the enzyme amylase to react completely with the substrate starch in a controlled concentration (3 cubic cm of each in every experiment). This has been investigated for seven different temperatures to find out how temperature affects the time taken for each reaction to take place.
It can be seen just by looking at the table directly above that as the temperature increased so the reaction took place quicker.
Again, to better understand what these results mean I have plotted them on a graph:
As you can see, this graph is quite similar to the one from the preliminary experiment. It shows a direct, negative correlation, again meaning that the higher the temperature the quicker the reaction took place. The results are all obviously quite accurate because they are all on a very similar line and a line of best fit was easy to draw. There were no anomalous results.
However, my prediction related to the rate of reaction, not just the time taken for each temperature. Therefore I must further process the data to be able to relate my results to my prediction.
To do this I have to find the rate of each reaction and plot it against the temperature recorded. To find the rate you take 1/time from the previous table, thus the rate of reaction for tube 1 (25ºC) is 1/230secs = 0.27 (2d.p.)
Seeing as how decimal numbers are quite difficult to work with I will multiply all the rates by 100 to make them easier to handle, thus:
Then, again, to better understand these figures, I have graphed them:
This graph (with a line of best fit drawn) shows the rate of each reaction against the respective temperature.
You can see that as the temperature increases so the rate increases. This coincides with my prediction in the planning phase of this investigation to a certain extent.
In my prediction I stated that the rate would increase up to the denaturing point of the enzyme when the rate would fall away. I then also drew a graph to display this and it looked slightly different. The prediction graph showed the line rising then falling away near the end as the enzyme denatured and then. My real graph on the other hand does not show this falling away of the rate. This can mean two things:
- That I made a mistake in my conduction of the experiment, or
- The temperature range that I used didn’t go high enough to encompass the temperature at which the enzyme denatures.
If the answer is the first one then I can’t see how that is possible because I can’t understand how this would have happened looking back at the investigation. The second, however, is obviously where I went wrong.
The results I obtained did however display some similarity to my prediction in that there would be a solid increase in the rate up to the denaturing point of the enzyme and this is clearly shown on my rate/temperature graph.
Relating back to my previously stated information; the increase in temperature increased the activity of the molecules in question, thereby increasing the chances of an enzyme-substrate complex being formed. This was shown to be true by the last graph because it shows the temperature increase to have a direct effect on the rate of reaction. Therefore I can draw the conclusion that by increasing the temperature at which the enzyme and substrate are reacting we can increase the speed and rate at which the reaction takes place.
Our brief was to investigate variables that affect the rate at which this type of reaction occurs. I believe that this was done quite successfully, apart from the fact that I didn’t manage to encompass the denaturing point of the enzyme in my experiment.
Looking back, I feel that I can say that this experiment was fair. I can say this because I know that every result was taken as precisely as I could possibly manage and every potential variable was controlled such as pH and concentration. The pH was controlled because every substance used in the investigation was taken from the same source. The concentration was controlled because each batch of starch and amylase was measured accurately before mixing. I can’t think of any way that the rate of reaction may have been affected, other than by varying the temperature, which was intentional.
The results were indeed accurate in relation to each other as two repeats of each individual temperature experiment were made to ensure maximum accuracy. The reaction completion times were all quite close together, implying an accurate procedure as the results were not spread all over the shop.
The control I conducted clearly showed that the amylase was the only catalyst of the biochemical reaction that turned the starch into maltose.
If I had to repeat this investigation I would take an even wider range of temperatures into account to encompass the denaturing point of the enzyme because this is an important part of investigating how temperature affects the behaviour of the enzyme.
Because I feel that otherwise the experiment went well and the method was foolproof, I would follow the same procedure and use the same variable and use the same equipment.
If I had had more time I would have liked to have looked at more/different variables and looked at different enzymes and their substrates and see how the variables affected their behaviour as well.