We can explain the effect of pH, temperature, substrate concentration and enzyme concentration by the collision theory. This theory suggests that reactions occur when the particles of the reactants (in this case the enzyme molecule and the substrate molecule) collide, providing they collide with a certain minimum kinetic energy. If there is a higher concentration of enzyme and substrate molecules then there is a higher chance of collisions and reactions taking place. The same goes for pH and temperature. Any factor that increases the number of collisions will increase the rate of reaction.
The rate of enzyme reaction is measured by the amount of substrate changed, or the amount of product formed during a certain period of time. Hence in this experiment, we are measuring how much oxygen is given off in a fixed time period.
Plan:
Before the experiment is carried out, I will prepare two preliminary experiments (which helped me to understand gas collection and the importance of standardization and control of important variables), one of which to decide which catalase to use, out of purified liver, yeast solution, crushed up celery and purified mushrooms. The other to decide what ratio of yeast:H2O2 will be used. I have chosen to use yeast rather than purified mushrooms or liver as my enzyme because the concentration of the purified liver and mushrooms was very varied and the surface area was not constant. It was also found that the yeast reacts extremely well with the H2O2. Whereas crushed celery stalks, hardly appear to react at all with the hydrogen peroxide. I have also chosen to use a 2:4 yeast:H2O2 ratio because this is a good quantity to use as the reaction will still take place with low values and I can collect accurate results, without the hydrogen peroxide + yeast solution rising too high up and going into the gas syringe.
The oxygen given off in this experiment when the catalase reacts with the hydrogen peroxide will be collected in a gas syringe (as shown in diagram above) rather than bubbling it through water, because if the O2 is bubbled through water, some of the oxygen would dissolve in the water, therefore using the gas syringe is a far more accurate way of collecting the oxygen. The only way the oxygen could escape by using a gas syringe is when injecting the H2O2 into the boiling tube. So, to reduce the volume of oxygen lost, an open bore needle will be used. This ensures that you don’t have to take the bung out of the boiling tube to inject in the H2O2, instead you can inject it through the bung. To reduce the volume of O2 lost even more, the syringe will be left in the open bore needle whilst the reaction is taking place.
To increase the accuracy in the measurements of yeast (2cm3 ) and H2 O2 (4cm3) used, the closest sized syringe is used. For example for yeast, as 2cm will be used per experiment, a 2cm syringe will be used. For H2O2 a 5cm syringe is used, as although 4cm3 of H2O2 will be used, the 5cm3 syringe is the closest size we can get to 4cm3 . Every sixty seconds, an observation will take place to see how much oxygen is collected, any less than this and the reaction between the yeast and hydrogen peroxide would still be taking place, any more than this and the reaction is likely to have stopped.
Five different concentrations of hydrogen peroxide will be used as the only variable, to see how it affects the rate of reaction. To make the different concentrations water and hydrogen peroxide should be mixed together in different ratios. See table below:
As the only variable being changed during this experiment is the concentration of hydrogen peroxide because many factors affect the activity of an enzyme, therefore they all have to be considered and controlled (made constant) so they don’t affect the results of the experiment and to make it a fair test. These factors are:
- The temperature- this is difficult to control as there are limited apparatus to use to keep it constant throughout the experiment, and there is only a limited time to do the experiment in. However it shall be done at room temperature, therefore, the experiment needs to be done on the same day to try and avoid temperature changes.
- Concentration of the yeast- 5% volume yeast shall be used throughout the experiment.
-
Volume of yeast per experiment- it has been decided to use 2cm3
- Volume of hydrogen peroxide per experiment- it has been decided to use 4cm
- Cleanliness of the apparatus- all the apparatus will be cleaned after each experiment to ensure it is a fair test. This will stop the different concentrations of hydrogen peroxide from mixing which would affect the results.
- And finally the pH
To increase the accuracy of the experiment each test shall be repeated three times, and an average shall be taken to plot on a graph. Also the stop clock shall be started as SOON as the very first drop of H2O2 hits the yeast, as the reaction starts straight away.
Method:
To carry out this experiment, set up two clamps, one holding the 100cm gas syringe horizontally (must be level), the other holding a boiling tube. Measure out 2cm of yeast carefully, checking the meniscus and ensuring there are no air bubbles, inject into the boiling tube and then stopper it with the open bore needle. Once the equipment is set up (see diagram) measure out (carefully-no air bubbles) and inject the 4cm of hydrogen peroxide through the hypodermic needle into the boiling tube, set the timer as soon as the first drop hits the yeast solution. Once all the H2O2 is in the boiling tube, leave the syringe in the needle to prevent any oxygen loss. After 60 seconds, remove the bung from the boiling tube and record how much oxygen has been collected in the set time. Reset the gas syringe to zero. Remember to wash the apparatus out in between each experiment.
Repeat this experiment three times per different concentration of hydrogen peroxide, by taking several readings for each enzyme concentration, the results could be averaged, to minimize chances of inaccuracies. The apparatus used are as follows:
- Two clamps, to hold the boiling tube and gas syringe steady.
-
100cm gas syringe, as no more than 100cm of O2 would be collected, and if it were a 50cm then it wouldn’t be big enough to collect all the oxygen.
- 5 boiling tubes. One for each concentration of hydrogen peroxide. This ensures even more that the different concentrations will not mix. Although they must be washed out between each repeat experiment.
- 5 5cm syringes for each of the different concentrations. This ensures even more that they don’t mix.
- 1 2cm syringe for the yeast. There is no need to have more than one, as there is only one concentration of yeast. (See plan for why there are different sized syringes for the yeast and for the hydrogen peroxide.)
- 5% vol of yeast. At least 30 ml of it so that there is enough for each test. (2cm for each test.)
- At least 12ml of each concentration of hydrogen peroxide, so there is enough for each repeat test (4cm for each test). Concentrations- 100%, 80%, 60%, 40% and 20%.
- An open bore needle so that you can inject the hydrogen peroxide into the boiling tube, through the bung, ensuring less oxygen escapes.
- A stop clock.
- A test tube rack-to keep the boiling tubes at room temp, instead of holding them-stops heat from hands warming boiling tubes.
Hydrogen peroxide is an irritant (see background information) so to work safely, and to protect myself from any damage; I shall wear safety goggles, a lab coat, and rubber gloves. At the end of the experiment, the bench should be disinfected in case there are any spillages such as hydrogen peroxide left on the bench.
Observations:
All measurements were taken as soon as 60 seconds had gone by. The stopwatch was started as soon as the first drop of hydrogen peroxide hit the yeast, this is because the reaction starts taking place straight away. Once the experiment had been started it was obvious a reaction was taking place, because gas was being collected in the gas syringe, and the oxygen given off was causing bubbling and fizzing in the boiling tubes. The quantity and speed of the oxygen produced is dependable on the rate of reaction. The faster the rate, the more gas collected, the slower the rate, the less gas collected.
Recording results:
The results are recorded in a table (see below), showing the concentration of hydrogen peroxide, the volume of oxygen collected in 60 seconds- for each of the three repeat tests, the average and the rate of reaction. This allows any patterns in the data recorded, to be easily identified. The rate of reaction was calculated by dividing the amount of gas (average) by 60. This is to show what volume of gas was collected per second. Showing the rate of reaction is important because it shows the quicker reactions as the higher values and the slower reactions as the lower values, making the graph easier to interpret. Overall trends in the data can be represented most effectively on a graph, as the patterns become more easily identified. Two graphs shall be drawn, one showing the average volume of gas collected in 60 seconds, the other showing the rate of reaction.
Results:
Volume of oxygen collected in
60 seconds cm3
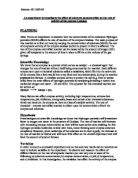
The graph ‘ The effect of hydrogen peroxide (substrate) concentration on the rate of activity of yeast (enzyme)’ shows the averages of each concentration repeat test, showing how much oxygen is collected in 60 seconds. The line of best fit is a straight line and the results show a very high positive correlation (meaning that the results increase as the x-axis values increase, and the results are very accurate, therefore following the trend and fitting the line of best fit). However if I carried on increasing the concentration of hydrogen peroxide, then the graph would curve off and level off. The graph should be slightly more curved at the end, but I used the wrong ratios, I should have used more hydrogen peroxide and done a 3:5 or 2:5 ratio, which would have made the graph level out more. This shows that the higher the concentration of hydrogen peroxide the quicker the rate of reaction, until there is no more enzyme molecules to react. Thus indicating that the enzyme concentration is directly proportional to the rate of reaction for the decomposition of hydrogen peroxide in the presence of yeast.
The other graph shows what the rate of reaction is per second. It shows that the higher the concentration (therefore quicker reaction), then the rate per second increases. The line of best fit is a straight line, and like the first graph, there is a high positive correlation.
Conclusion:
The reaction was at its fastest, when the concentration of the hydrogen peroxide was 20 vol (100%). Here there were the largest number of substrate molecules to react with the enzymes, therefore there was a greater volume of oxygen and water produced. The rate increased steadily from 19.67cm oxygen collected, to 77.67cm collected, until there was no more enzymes left for the substrate to react with, hence the graph gradually leveling out. Other factors such as increasing the temperature and increasing the enzyme concentration would increase the rate even more if used along side the increase in substrate concentration. However as these were kept constant throughout the experiment, they prevented any further increase in the rate of reaction. The rate increases when there is an increase in the concentration of the substrate, because of the collision theory. There is an increase in the substrate (hydrogen peroxide) therefore more collisions between the substrate and the enzyme (yeast) can take place, causing the rate of reaction to increase, and the activation energy (amount of energy needed for the reaction to take place) to decrease.
The results were as I predicted in the hypothesis. I predicted, “As the concentration of the substrate increases, the rate of reaction should also increase, until the substrate molecule fills all the active sites on the enzyme molecule, or until there are no more enzyme molecules to react. However, in when there is a lower concentration of the substrate molecules, the increase in rate of reaction is limited and will have little effect.” This is because a number of factors influence the decomposition of hydrogen peroxide, such as temperature, concentration of substrate, and concentration of enzymes. The reaction is dependant by their availability. These factors are needed for the reaction to take place efficiently. For example in this experiment, the substrate concentration was varied, but the the enzyme concentration was the same, I tried to keep the temperature constant all the way through the experiment, however, due to the limitations, and lack of resources the temperature fluctuated slightly. The reaction took place sufficiently, up until a certain point, when all the enzyme molecules’ active sites were filled with the substrate molecules. So if the enzyme concentration was increased as well as the substrate concentration, then the rate of reaction would increase dramatically, and if you heat it to 37 C too.
Limitations and improvements:
In my results there is an anomalous result. This means it doesn’t exactly fit the pattern. However to overcome this problem I repeated the concentration with the anomalous result a fourth time, and ignored the anomalous result, when taking the average, as this would have shown up on the graph as completely out of place. I haven’t ignored this result completely though, on graph 1, where I plotted the averages, I included the anomalous result in pencil, to show that there was one, but I didn’t include it in the averages, hence it drawn on in pencil. This result occurred as I didn’t wash out the hypodermic needle in between two repeat tests, so a hydrogen peroxide bubble was lodged in it causing the next lot of hydrogen peroxide to be injected in to dribble out of the needle and down the boiling tube. This meant that not all the substrate molecules were mixed with the enzyme molecules, showing up in the results as if it had been a lower concentration test. Rather than the 60% (12 vol) that it was. It was easily rectified though, all it needed doing to it was to wash the needle out each time and after that all the results followed the pattern.
In this experiment the concentrations ranged from 4vol to 20vol going up each time by 4 vol. However a control concentration should have been included to show that the substrate concentration affects the rate of reaction, and to show that it is the variable, substrate concentration, that is measured. The control concentration would have been 0% (0 vol), in other words, 100% water.
Another limitation is that as the yeast and hydrogen peroxide didn’t mix properly the reaction might not have reacted to the highest potential. The only way to stir the 2 reactants is to use a stirring rod, however, that would mean taking out the bung to stir it causing a huge volume of oxygen to be lost. If I had access to better equipment, I would use an electronic magnetic stirrer.
Although the temperature was kept as constant as possible there could have been very slight temperature changes in the room which could not be controlled. I would also need to control the amount of sunlight, by keeping the hydrogen peroxide in brown bottles in the shade. A test tube rack was used to try and limit the amount of physical contact with the boiling tubes, I failed to use test tube tongs, so I still held the boiling tubes when taking them from the test tube rack to the clamp. The failure to do this meant the results could have been affected, as the extra heat from my hands might have increased the temperature of the boiling tube, causing increase in the rate of reaction.
Due to limited time and resources, there was no possible way to control the pH, or the exact temperature. Therefore this might have led to a change in the rate of reaction. I can only presume that the pH was the same all the way through the experiment, as there was nothing within the room that could have altered the pH dramatically.
The major limitation in this experiment was the time. Meaning that only 5 concentrations could be used, and there was not enough time to repeat each test more than 3 times, therefore only general, overall trends could be identified in the results. They can only be approximated and are not necessarily accurate.
A further cause of inaccuracy is individual operator error, for example whilst reading the meniscus, to measure the volumes, slightly different eye-level positions would cause slight over or under estimations.
To make this experiment more accurate in the future, a greater number of substrate concentrations between those already recorded should be tested reducing the possibility of any anomalous results. To reduce the chance even more, repeat each test far more than 3 times. In the experiment I could have recorded how much gas was collected every 10 seconds, up to 1 minute, for an even more accurate set of results.
If I had had the equipment and the time, I would have used an incubator to keep the temperature constant. I tried to keep the syringes as accurate as possible, i.e. as 2cm of yeast was used I used a 2cm syringe and checked to see if the meniscus was lined up to the correct mark. For the hydrogen peroxide, 4cm was being used, there was no 4cm syringes available so I used the closest size to it which was a 5cm syringe, and checked the meniscus again. However, again if I had the correct resources, I would have used a micropipette as this can measure extremely small measurements, such as a tenth of a millimetre.
My results were moderately reliable as all the repeat tests were within 1cm of each of the same concentration tests. E.g., for the 20% concentration, the 3 results were; 20, 19 and 20. Causing the average to be 19.67 to 2dp. However my result’s unreliability was mainly due to the fact only one variable could be controlled, all other factors that increased the rate of reaction could not be kept constant. In spite of this, the experiment has proved my hypothesis.