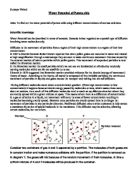
Hypotonic Solution:
Hypotonic solution is less concentrated than the concentrated solution in the cell’s cytoplasm and the cell sap in its vacuole.
If a plant cell is surrounded by water or a solution more dilute than its contents, water will pass into the vacuole by osmosis. This is because there are more free water molecules outside the cell than the inside. The vacuole will expand and press outwards on the cytoplasm and the cell wall. A plant cell with the vacuole pushing out on the cell wall is said to be turgid and the vacuole is exerting pressure on the cell wall.
Hypertonic Solution:
Hypertonic solution is more concentrated than the cytoplasm and the cell sap of the vacuoles in the cell. It has few or no free water molecules.
When a plant cell is placed in a solution more concentrated than its contents, water will pass out through the vacuoles into the solution by osmosis. It is because there is less number of free water molecules in the solution than the cell sap. The cell will lose its turgidity and become flaccid.
Isotonic Solution:
Isotonic solution has the same concentration as the cell’s cytoplasm. It has equal number of free water molecules as in the cell’s cytoplasm.
If a plant cell is surrounded by a solution having the same concentration as that of its contents, osmosis wouldn’t be taking place and there would be no net movement of water as the number of free molecules are same on either side of the semi-permeable membrane.
Factors affecting Rate of Osmosis
The rate of osmosis is often varied due to different factors. They are as follows:
- Concentration Gradient
- Temperature
- Surface area
- Size of the molecules
- Thickness of the surface (Semi-permeable membrane)
Concentration Gradient:
Osmosis occurs only when there is a difference in the concentration of two solutions separated by a partially permeable membrane. Therefore, as the difference between the concentrations increases, so does the osmosis rate. This is because the water molecules tend to move faster with the increase in concentration difference.
Temperature:
Temperature affects osmosis in a direct proportion. As the temperature increases, the rate of osmosis also increases. This is because the temperature provides the water molecules with more energy, thereby making them more mobile. This helps them to travel faster across the membrane. At very high temperature the rate of osmosis falls because the proteins in the cell membrane are destroyed. At very low temperature osmosis rate drops sharply because the molecules have very less energy.
Surface area:
If the surface area of the semi-permeable membrane is more, then the rate of osmosis is also more. The reason for this is that, the more the surface area, the more the number of molecules that can pass at one go, as more area of the semi-permeable membrane is exposed to the solution. So, when the surface area is less, the rate of osmosis decreases because only a few can pass at one time.
Size of the molecule:
Size of the molecules comes into consideration while sorting out the rate of osmosis because the molecule has to be of a smaller size than that of the pores in the membrane. Large molecules stay in one side. Small, fit molecules are only allowed to travel across. So as the size of the solute molecules increases the rate of osmosis decreases as they will take more time to travel across the semi-permeable membrane.
Thickness of the surface:
When the partially permeable membrane is thick, the water molecules have to travel longer distances across the semi-permeable membrane. This reduces the rate of osmosis. Therefore, osmosis is faster if two solutions are separated by a thin membrane as water molecules have to travel a less distance.
PLANNING
OUTLINE METHOD
Apparatus
- Cork Borer
- Petri Dishes
- Measuring Cylinder
- Beakers
- Glass Rod
- Top-pan Balance
- Ruler
- Knife
- Spatula
Materials
- Glucose solutions (0.25 molar, 0.50 molar, 0.75 molar and 1 molar)
- Potatoes
- Water
Risk Assessments
- I will be careful with the knife and cork borer, in order not to hurt myself.
- I will be careful in handling all glass apparatus as they are brittle.
- I will handle the electric points with care and see that I do not touch them with wet hands.
- I will keep all solutions away from the electric points in order to avoid spillage on them.
- I will make sure that I do not spill anything on the floor.
Precautions
- I will choose fresh potatoes to get accurate results.
- I will make sure that all potato pieces are submerged in the solution.
- I will clean the Petri dishes to get rid of the dust.
- I will cut all the potato strips to a same length.
- During measurements of water in a measuring cylinder, I will check the lower meniscus to avoid perplex errors.
- I will check the Petri dishes and beakers for cracks to avoid any leakage of the solutions.
- I will label the Petri dishes and beakers so that I do not get confused.
- I will cover all the Petri dishes and beakers so as to avoid the formation of fungi in the glucose solution.
- I will use 4 different solutions in order to get a range results.
- I will use 4 potato strips in each solution and take their average length and mass, for my result to be accurate and fair.
Factors to be controlled
Temperature:
Increase in temperature will increase the rate of osmosis as the temperature will provide the molecules with more energy and make them more mobile. Due to this reason, all the Petri dishes should be left at a constant temperature for osmosis to occur; otherwise we can not compare the rate of osmosis in each solution accurately. If one Petri dish is in a higher temperature, its osmosis rate will increase and we may end up getting two different concentrations showing the same rate of osmosis. This can be done by maintaining the temperature of the room in which the Petri dishes are placed.
Surface Area:
Increase in surface area will allow more water to travel across the membrane at one go. Therefore, the surface area of all the potato strips should be the same for our comparisons of the rate of osmosis to be accurate. If all the strips do not have the same surface area, some will get more access to the solution, while some strips will get less access. This will result in inaccuracy. This can be done be cutting the potato strips using a cork borer to get a smooth surface and then resizing it to a similar length. This will result the potatoes to have the same surface area.
Time:
As the time interval increases, more osmosis occurs. This factor should be controlled otherwise; some may have more time for osmosis, while some will have less time for osmosis. This will lead to inaccuracy while finding the isotonic point of the cell sap. This can be controlled by submerging all the potatoes in their respective solutions at the same time.
Method
At first, I will prepare glucose solutions of concentrations 0.25 molar, 0.5 molar, 0.75 molar and 1 molar solution in beakers and label them respectively. I will do this by adding the right amount glucose in 1 litre of water.
I will then wash the Petri dishes and dry them. Then using a No. 5 cork borer, I will cut out 20 potato strips. To do this, I will place a potato on a board and push the borer into it. Then using a smaller borer push the strip out of the No.5 cork borer. I will cut them all into a similar length of 3 cm using a knife. I will then measure the mass of each strip and note them down. Next, I will place 4 strips in each Petri dish and label the covers of the dishes for the concentrations. I will then pour the corresponding solutions in the Petri dishes and see that the strips are submerged and close it immediately. I will then leave the potato strips for the next 24 hours for osmosis to take place.
I will then drain off the solution and measure the new length and mass. Then I will tabulate all my results in the format shown below and analyze my results. Later I will plot a line graph to find the molarity.
Calculations to be used
Difference in the mass is calculated by the formula:
Difference = (average of final mass - average of initial mass)
Difference in the length is calculated by the formula:
Difference = (average of final length - average of initial length)
Percentage change in length is calculated by:
Percentage change = (difference/initial length) x 100
Percentage change in mass is calculated by:
Percentage change = (difference/initial mass) x 100
Predicted Results
In case of water, the potato strips will gain mass and increase in length as water will enter the cells by osmosis. This is because the cells have less number of free water molecules than the solution. So, water molecules will enter the cell to maintain concentration on either side of the semi-permeable membrane.
In the sugar solutions, the potato strips will lose mass and decrease in length as water will exit the cells by osmosis. This is because the cells have more number of free water molecules than the solution. So, water molecules will exit the cell to maintain concentration on either side of the semi-permeable membrane. As concentration of the solution the cell is in increases, the length and mass decrease also increases.
At a particular concentration there would be no net movement into or out of the potato strips. This is because both are of the same concentrations. This concentration would give me the molarity of the cell sap. I can determine this concentration by plotting a graph similar to the one shown below.
Prior Test
I had performed a prior test, in order to verify whether my method would work out well. Doing this helped me to get used to the apparatus, procedure and the precautions I had to follow and so that I could improve my results later on.
I had performed the prior test using only 2 solutions, of concentrations 0 molar and 1 molar. The time duration I used was only 10 minutes and used 4 potato strips for each solution.
Firstly, I had to prepare the 1 molar solution. I cut out 8 strips of potato using a cork borer and made them of the same length of 3 cm. I then measured their mass and noted them down. Then I washed and dried the Petri dishes. I poured out the solutions into two Petri dishes and labelled them. I then placed 4 potato strips in each solution and covered it with a lid. I left the two sets for the later 10 minutes for osmosis to occur.
After 10 minutes, I drained the Petri dishes and measured the new length and mass of the potato strips and noted them as final length and final mass respectively. Then I tabulated my results, which are shown below.
In the experiment, I found that in 1 molar solution the length and mass of the potato strips had decreased and in water the length and mass had increased – this is shown in the table above.
The results of the experiment match my predicted results and therefore I feel that my method was successful.
In my actual and final experiment I will be using 5 different concentrations in order to get a range of results. I will leave the potato strips submerged in solutions for 24 hours instead of 10 minutes so as to allow osmosis to occur effectively. I will also be more precise in carrying out various activities while experimenting in the future.
OBTAINING EVIDENCE
OBTAINING EVIDENCE
Apparatus
1. Cork Borer
2. Petri Dishes
3. Measuring Cylinder
4. Beakers
5. Glass Rod
6. Top-pan Balance
7. Ruler
8. Knife
9. Spatula
Materials
1. Glucose solutions (0.25 molar, 0.50 molar, 0.75 molar and 1 molar)
2. Potatoes
3. Water
Risk Assessments
- I was careful with the knife and cork borer, in order not to hurt myself.
- I was careful in handling all glass apparatus as they are brittle.
- I handled the electric points with care and made sure that I did not touch them with wet hands.
- I kept all solutions away from the electric points in order to avoid spillage on them.
- I made sure that I did not spill anything on the floor.
Precautions
- I chose fresh potatoes to get accurate results.
- I made sure that all potato pieces were submerged in the solution.
- I cleaned the Petri dishes to get rid of the dust.
- I cut all the potato strips to a same length.
- During measurements of water in a measuring cylinder, I checked the lower meniscus to avoid errors.
- I checked the Petri dishes and beakers for cracks to avoid any leakage of the solutions.
- I labelled the Petri dishes and beakers so that I did not get confused.
- I covered all the Petri dishes and beakers so as to avoid the formation of fungi in the glucose solution.
- I used 4 different solutions in order to get a range results.
- I used 4 potato strips in each solution and took their average length and mass, for my result to be accurate and fair.
Method
Firstly, I prepared the glucose solutions of 0.25 molar, 0.50 molar, 0.75 molar and 1 molar solutions in labelled beakers. I did this by dissolving the right amount of glucose in 1 litre of water. Then I cut out 20 potato strips from a fresh potato using a cork borer. I resized them all into a length of 3 centimetres. I washed the Petri dishes to get rid of the dust and make them clean. I poured out the glucose solutions in the Petri dishes and labelled them respectively. I then measured the mass of the potato strips and noted them. After that I placed 4 strips in each solution, making sure that they were submerged completely. I covered the Petri dishes using their lids. I left the 5 sets for the next 24 hours.
After that, I drained the solution from the Petri dishes and measured the length and mass of the potato strips and noted them down.
Diagrams of my method
Results obtained for Mass
In the above table I noticed that there was a decrease in the mass of the potato strips for the glucose solutions of 1 molar, 0.75 molar and 0.50 molar. This is because the solution was more concentrated than the cell sap of the potato cells and therefore free water moved into the solution from the cells to maintain the concentration on either side of the membrane. 0.25 molar glucose solution however showed an unexpected result of positive percentage change. The only probable reason for this is that the molarity of the strips was more than 0.25 molar solution.
The potato strips that were in water increased mass because water entered the potatoes by osmosis. The cell sap of the potato cells had less number of free water molecules compared to the solution and there free water molecules from the solution entered the potato cells.
Results obtained for Length
The length of the potato strips had decreased when there were in the glucose solutions. This is because there were more free water molecules in the potato tubers’ cells and less in the solution. Therefore the free water molecules from the potato strips moved to the solution through the semi-permeable membrane to maintain the concentrations.
The potato strips that were in water increased in length as water molecules entered through the semi-permeable membrane by osmosis. Osmosis was carried out because the potato cells had less free water molecules than the solution.
ANALYSIS
ANALYSIS
In my experiment, I had taken 5 different solutions with 4 strips of potatoes in each solution. After leaving it for the next 24 hours, I found that water had a positive percentage change and for the glucose solutions except for 0.25 molar, I got a negative percentage change in case of mass. But in case of length, all glucose solution showed a negative percentage change. I have included the results of my final test in the obtaining evidence section. Now I am proceeding to analyze my results in order to find the morality of the potato tuber.
Mass
Summary Table for Mass
Trends in the above table
All the glucose solutions except for 0.25 created a negative percentage change. The highest negative change is in 1 molar solution which is -23.12%, followed by 0.75 and 0.50 molar which are -17.65% and -1.66% respectively. The negative change is due to the water flowing out of the potato strips into the solution thereby decreasing its mass. For water and 0.25 molar solution, there was a positive change of 24.32% and 11.89% respectively.
Length
Summary Table for Length
Trends in the above table
When the potato pieces were in the 1 molar solution, it had a negative percentage change of –10.00%, which means that the length had decreased by 10.00% of the initial length. Negative change was seen as well in the case of 0.75 molar, 0.50 molar and 0.25 molar glucose solutions. In case of 0.75 molar, it was –7.33%, for 0.50 molar, it was –4.00% and in case of 0.25 molar, it was –0.67%. Therefore, all the glucose solutions lead the potato strips to reduce in size. When the potato strips were in water there was a positive percentage change of 5.83%.
It is noticeable that the less the concentration of the solution, the less the decrease of mass and length in its potato pieces; it is in fact increasing after a certain reduction in concentration.
Trends in the Bar Charts
Bar Chart for Mass:
I plotted a bar chart out of the summary table. I took ‘Concentration’ in the X-Axis and ‘Percentage Change’ in the Y-Axis. For all the glucose solutions, except for 0.25 molar solution, there was a negative change and therefore I got a negative bar for 1 molar, 0.75 molar and 0.50 molar solutions. For 1 molar solution there was a negative change of -23.12%; for 0.75 molar there was a negative change of -17.65% and for 0.50 molar solution there was a negative change of -1.66%. Water, as expected gave me positive change of 24.32% ad so I got a positive bar. They are all scientifically correct.
0.25 molar solution however created an unexpected result which is a positive change of 11.89%.
Bar Chart for Length:
I plotted a similar bar chart as that of the bar chart for mass. I took ‘Concentration’ in the X-Axis and ‘Percentage Change’ in the Y-Axis. For all the glucose solutions there was a negative change and therefore I got a negative bar for all of them. The highest negative change of -10.00% was in 1 molar solution followed by 0.75 molar which was -7.33%, 0.50 molar which was -4.00% and 0.25 molar which was -0.67%. Water, as expected gave me positive change of 5.83% and so I got a positive bar. They are all scientifically correct.
Scientific Explanation
1 Molar solution: The result obtained from 1 molar solution is the decrease in both length and mass of the potato strips. There was a negative percentage of -10.00% in length and -23.12% in mass. Decrease percentage in 1 molar was more than the rest of the glucose solutions. Scientifically explaining, the water from the potato cells has moved out into the solutions by osmosis. This happens due to the difference in the concentration of free water molecules on either side of the semi-permeable membrane. In this case, the semi-permeable membrane is the cell membrane of the potato. In case of 1 molar solution there is more number of free water molecules in the potato cells than in the solution. Therefore, free water molecules from the potato cells moved through the semi-permeable membrane into the solution to maintain an equal concentration on both sides of the membrane. Reduction of water from the strips resulted it to shrink in length and lose mass.
0.75 Molar solution: The 0.75 molar solution showed similar change as in 1 molar solution but only at a reduced degree. The scientific reason for this concentration is similar to that of 1 molar concentration. Here it is only a reduced level of change due to the use of a weaker solution compared to 1 molar glucose solution. There is more number of free water molecules in the cell and so passes into the solution to maintain concentration on both sides of the membrane. 0.75 molar solution resulted a negative percentage change of -7.33% and -17.65% from length and mass respectively. For 0.75 molar solution, the change was more than that of 0.50 molar and 0.25 molar solutions.
0.50 Molar solution: This solution created a similar effect on the potato cells but only at a reduced level. 0.50 molar glucose solution was more concentrated than the cells’ contents and had less number of free water molecules compared to the cells’ contents which led to the exchange of free water molecules from the cell sap to the solution to maintain the concentration on either side of the semi-permeable membrane. Here the cell membrane of the potato cell is the semi-permeable membrane. The results are similar to the ones predicted. There was a change of -4.00% for length and -1.66% for mass. It has a greater change than 0.25 molar solution.
0.25 Molar solution: For 0.25 molar solution the result was quite unexpected as there was an increase in mass of the potato strips, however there was decrease for the length. The only explanation for the increase in mass is that, the concentration of the cells’ vacuole might be more the solution. Increase in mass shows that some of the free water molecules from the solution managed to diffuse into the potato strips by osmosis. In this solution the length decreased by -0.67% and mass increased by 11.89%.
Water: As predicted, water had a positive change in both length and mass, showing that the cell saps of the potato cells were more concentrated than water. Free water molecules from the solution had entered the strips. Length increased by 5.83% and mass increases by 24.32%. The increase in mass is due to the extra water molecules that had entered by osmosis. The increase in length shows that water that entered made the cells turgid.
Determination of molarity
I decided to find the isotonic point by plotting the percentage change in length against the percentage change in mass in a line graph. I took the concentrations in the x-axis and the percentage change in the y-axis. After plotting the graph, I noted the values of the points where the lines intersected the x-axis. The value of the point where the lines intersected the x-axis is 0.225 and 0.475 for length and mass respectively. I then calculated the average of these values to find that the isotonic point which is 0.35 molar. Therefore the molarity of a potato tuber is 0.35 molar. Since the molarity of the potato strips were more than 0.25 molar, I got a positive percentage change for mass. It is because there were more free water molecules in the solution than in the potato cells, which moved into the cells through osmosis and resulted in the slight increase in mass.
How far I have reached my predicted results
I had predicted that there would be a decrease in length and mass of the potato strips for all the glucose solutions. For water, I had predicted that there would be an increase in the length and mass.
The results for all the glucose solutions, except 0.25 molar were in line with my prediction. All glucose solutions except 0.25 molar produced a decrease for both length and mass. 1 molar produced a change of -23.12% for mass and -10.00% for length. This is followed by 0.75 molar which had a negative percentage change of -17.65% for mass and -7.33% for length. For 0.50 molar there was a change of -1.66% for mass and -4.00% for length. I did not expect the increase of 11.89% in mass of the potato strips in 0.25 molar glucose solution. However, the length had decreased by -0.67% for 0.25 molar solution which I had expected. Water provided satisfactory results which matched with my predictions. There was an increase for both mass and length by 24.32% and 5.83% respectively. Since most of my results match my predicted idea, I feel that my experiment was a success.
EVALUATION
EVALUATION
In my experiment, I used 5 different solutions and 4 pieces of potato strips in each solution and left them for 24 hours for osmosis to occur and then note down the results for the analysis and evaluation. I had enough time and the required apparatus and also was able to handle them well. So, I feel that my method was good enough to give accurate results.
I did not have any anomalous results.
Errors
A few errors might have occurred during my experiment in spite of all my precautions.
- An error could have happened with the potato sizes as they were hand cut.
- I might have noted or misplaced some values wrongly.
- I might have added a slightly different amount of glucose in preparing the solutions.
- The room temperature might have varied during the 24 hour period because during non-working hours, the air conditioning system of the laboratory is switched off.
Accuracy and reliability of my results
In order to find the molarity of the cell sap of a potato tuber I performed this experiment based on osmosis. I prepared 5 glucose solutions of concentrations 1 molar, 0.75 molar, 0.5 molar, 0.25 molar and 0 molar (water). I used 20 potato strips and in each solution I placed 4 strips. I made notes of its initial length and mass. I left it for 24 hour time period for osmosis to occur before taking its final length and mass.
All the glucose solutions except 0.25 produced a negative percentage change for both length and mass, which was according to my predictions. The negative percentage change was due to the transfer of free water molecules from the cells to the solution. For 0.25 molar solution there was a positive change in mass. Since I had found the isotonic point of the potato strips as more than 0.25 molar; this explains why 0.25 molar created a positive percentage change. The molarity of the cells was more than 0.25 molar and therefore free water molecules entered to increase the mass.
The results produced by water were also satisfactory as it had a positive percentage change for both length and mass. Since the molarity of the tubers was more than water, free water molecules from the solution moved into the cells, thereby making them turgid.
During my experiment, I used 4 potato strips and had taken their average in order to maintain accuracy. Since I found a lot of repeated values in my results, I think my experiment was accurate enough to be relied upon. I believe that even in a successful experiment, there is very less chance obtaining a very precise and accurate results. This may be because of human errors or apparatus variations or other factors.
Extension Work
Apparatus:
- Microscope
- Beakers
- Measuring cylinders
- Blade
- Cover-slip
- Pipette
- Blotting Paper
Materials:
- Rhubarb Stalk
- Glucose solutions (0.25 molar, 0.50 molar, 0.75 molar and 1 molar)
Another experiment could be done by plasmolysis. I would need to peel a small piece of epidermis from a red area of a rhubarb stalk. Then I will have to place the epidermis on a slide and pour a drop of water over it with a cover-slip and pour sugar solution which consists of 0.50 molar glucose solution at one edge of the cover-slip with the help of a pipette. Then I would draw the solution under the microscope. This could be done by putting a piece of bolting paper on the other side. While doing this, I could study different cells under a microscope in order to see any change in their length using a micrometer.
We could observe the effect on the size of the stalk cells by using various concentrations of glucose solution (0.25 molar, 0.50 molar, 0.75 molar and 1 molar). My prediction for this experiment is that, in case of glucose solutions the cell would shrink as water would flow out but for water there would be an increase in its size, making it turgid because of the water that will enter by osmosis.
For each solution, we will note down the final length of the cell and find the difference from the initial length and calculate the percentage change. Then, plot a line graph with ‘concentrations’ in the x-axis and ‘percentage change’ in the y-axis and find out the molarity. The value of the point, the line would intersect the x-axis would give us the isotonic point and the molarity of the cell sap.
Bibliography
- GCSE Biology (Third Edition) – D.G. Mackean
- GCSE Biology For You – Gareth Williams