By using a graph of my final results I hope to obtain a reasonable value for the concentration of sucrose solution inside the potato tissue (the cell sap).
Experiment
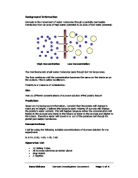
List of Apparatus
1 Fresh Potato Tuber
2 Test Tubes (x6)
3 Labels and pencil
4 25 cm3 and 50cm3 measuring cylinders
5 Tile
6 Distilled Water
7 Sugar
8 Weighing scales
9 Stirring rod
10 Ruler (with cm scale)
11 Scalpel
12 Forceps
13 100cm3 beaker
The Method
1 Firstly I will label six test tubes appropriately, one for each of the following: distilled water (0), 0.2 molar, 0.4 molar, 0.6 molar, 0.8 molar and 1 molar sucrose solutions.
2 I must first make the 1 molar solution by measuring out 50cm3 using the 50cm3 measuring cylinder. I will then add it to one of the beakers and stir in 17.1g of sugar using a stirring rod until all of it dissolves.
3 Using a 25 cm3 measuring cylinder, a beaker of distilled water and a beaker of 1 molar solution sucrose solution, I will make up 20 cm3 of sucrose solution of the required concentration in each test tube. The table above shows the amounts needed to be used in each case. It is far less time consuming to create the solutions in this way as well as being far more accurate. If I did not use this method of obtaining the solutions then I would have to calculate and measure out the weight of sugar for each concentration (shown below). Due to the amount of weighing needed there are more opportunities for errors – this is why I will not be using this method in my main experiments.
4 I will shake the test tubes or use the stirring rods to mix the solutions thoroughly.
5 I will then prepare the potato tissue by using a core borer. I must select one potato and use the core borer to make as many potato cores as possible. Ideally in order to obtain a good set of readings, the potato core samples should be as large as possible so that measurements are taken of the diameter and the length to a reasonable degree of accuracy. For this reason I will choose a large potato and the largest core borer I can find to cut out the potato tissue, in such a way that I obtain the largest cores possible.
6 Once I have cut out the potato cores I will select six of them (make sure that they are free of ‘eyes’ or any other such abnormalities that may affect the results). I must clear the six samples of any skin by holding the potato core in place with the edge of the forceps and remove the skin by gently scraping at it with the scalpel. I will then cut them all to the similar size being sure that the cut ends are perpendicular to their lengths.
7 I must then measure the dimensions of the potato cores (length and diameter) using the centimetre scale on a ruler and recording them in a table (titled: ‘Initial Readings’). All of my measurements will be taken to the nearest 0.5mm.
8 I will then place the potato cores in the solutions in the test tubes and leave them for 24 hours taking note of the dimensions of the potato cores in each test tube.
9 After the 24hour period I must remove the potato cores from the test tubes and take the final dimensions using the same units on the same ruler and recording them in an identical table as previous (titled: ‘Final Readings’).
10 I will then calculate the change and percentage change in volume from the tables and create a bar chart showing the change in volume and plot a line graph to show the percentage change in volume.
11 I will repeat the experiment a second time cutting the potato cores to a similar size (so the two experiments can be compared). Then I will analyse the results and draw graphs and conclusions from them.
How to make it a safe test
I believe that this investigation as a whole poses a very little threat of danger. However, I do realise the importance of considering all of the potential hazards. The scalpel and the forceps seem to be the only dangerous instruments that need to be used. I must be sure to always know where they are and to use them carefully. The test tubes also pose a threat. If broken the sharp pieces of glass can be harmful. This is why I must also be careful with them.
How to make it a fair test
To ensure that my experiments are fair tests I will apply the following ‘rules’.
- Use the same ruler for the initial and final dimensions in both experiments
I must use the same ruler for consistency; this is a matter of great importance when you consider the small readings that must be recorded.
Each variety of potato has different characteristics and even potatoes of the same variety can differ. By using potato tissue from the same potato I ensure I am not getting any false results. To ensure that the sucrose concentration is the only variable in this investigation the cores should come from the same potato.
- Use the same sized potato cores
This means that the surface area in contact with the solution is the similar for each core, further reducing the variables in this experiment.
- Keep the amount of water/sucrose solution constant
Keeping the water concentration at a constant volume cancels out yet another variable.
- Potato core should be kept at room temperature
Temperature is a factor that affects the rate of osmosis. As the temperature increases, the speed of the particles in the solutions and in the vacuole of the cells increases. This means that the net movement of water particles is faster. This introduces another variable in the experiment that must be eliminated.
- Use large rods of potato – to observe the change in size more accurately
Due to the limited measuring equipment available to me (i.e. a ruler) it is crucial that the potato cores are as large as possible. This will make it easier to measure the initial and final dimensions and so I will be able to obtain a more accurate set of results.
- Use parts of the potato that are not damaged
If I use a potato core that is damaged or bruised in any way then it might affect my results. This is why the specimens should be free of any such flaws.
- Wash and dry out every test tube
To make sure that the water/sucrose solutions are not contaminated when put into the test tubes, I will wash each of them out with water and dry them, as any water left in the test tube would further dilute the solutions.
- Cut the potato cores perpendicular to their length
If I did not cut the potato core perpendicular to their length then it is possible for a number of readings for the diameter to be obtained. By cutting the potato core perpendicular to their length then it is only possible for one true reading for the diameter to be obtained.
The only factor that will be purposely inconsistent in this investigation is the water concentration. (The water concentrations will range from 0 molar to 1 molar of sucrose solution.) All of the other variables in the experiment must be eliminated!
Graphs and Results
The results obtained from my experiments are shown in tabulated form (see tables for experiment 1 and 2). These show volume change and percentage volume change between the initial and final readings. From the tables I have produced a bar chart of the volume change vs. molarity of sucrose solution illustrating the results of experiment 1 and 2. I have also created line graphs of percentage change in volume vs. molarity of sucrose solution illustrating the results of experiment 1 and 2, the average results and a best fit line.
Preliminary Experiment
I will first carry out a far simpler experiment where only the extremes are tested. I will do this because it will hopefully give me a greater understanding of the expected results in the main experiments and it will provide an opportunity to run through similar procedures to that of the main experiments.
I will use the same method as the main experiments except that I will only prepare three water concentrations – 0.0 (distilled water), 0.5, and 1.0. The dilutions of the 1 molar sucrose solution for the concentrations are shown below.
Results: Experiment 1and 2
Bar graph to show the change in volume of three potato cores immersed in varying concentrations of sucrose solutions for 24 hours
Experiment 1
Line graph to show the percentage change in volume of six potato cores immersed in varying concentrations of sucrose solutions for 24 hours
Experiment 1
Experiment 2
Results: Average of Experiment 1and 2
Line graph to show the average percentage change in volume of six potato cores immersed in varying concentrations of sucrose solutions for 24 hours
Average of experiment 1 & 2
Analysis
When I examine the extreme results of this experiment I observe from the average line graph (green) that the volume of the potato tissue submerged in the one molar sucrose solution over the period of 24hours decreased (by an average of 33.56%), whereas the volume of the potato tissue submerged in the distilled water for the same period of time increased (by an average of 39.56%)
One of the most important factors that I would hope to determine from this investigation, is the molarity of sucrose solution at which there is no net movement of water through the semi-permeable membrane (cell membrane). The concentration of sucrose solution at which this takes place is the same as that of the concentration of the cell sap inside the vacuole. My observations from the graphs, which I have produced, are shown below.
I would say that the average results probably represents the more accurate picture for obtaining the value of molar sucrose solution at which there is no net movement of water because at this point on the graph the best fit line lies outside the range of values obtained in the individual experiments. Therefore I would estimate that the molarity at which there is no net movement of water is 0.43 molar sucrose solution.
Further more, when I inspected the individual results of the experiments on the graph, I can see that experiment 2 almost represents a true linear relation, whereas the results for experiment 1 tend to be more erratic. This leads me to expect the point of equilibrium will be nearer the value of 0.40 molar sucrose solution (experiment 2) than 0.46 (experiment 1).
Conclusion
From the analysis of results I have found that there is no net movement of water through the semi permeable membrane when the sucrose solution is at an approximate value of 0.4 moles. This represents the value of the sucrose concentration of the cell sap.
When the concentration of sucrose solution is greater than 0.4 moles then there is a net movement of water from the potato tissue to the surrounding solution resulting in the potato tissue decreasing in volume. Conversely, when the concentration of sucrose solution is less than 0.4 moles there is a net movement of water from the surrounding sucrose solution through the semi-permeable membrane into the potato tissue resulting in the potato tissue increasing in volume.
I can also make the conclusion from my graphs that it is likely that the relationship between the change in volume and the concentration of the sucrose solution is linear.
Further more, when measuring the samples of potato tissue I noticed that the potato tissue that was immersed in the 1 molar sucrose solution for 24 hours was flaccid indicating that most of it’s cells had become plasmolysed, whereas the sample of potato tissue immersed in distilled water was firm indicating that most of it’s cells had become turgid. The samples of potato tissue immersed in the varying concentrations of sucrose solutions between the two extremes were either plasmolysed or turgid to varying degrees relative to the concentration of sucrose solution.
A further observation that I made was that when the potato tissue was immersed in the 0, 0.2, 0.4 and 0.6 molar sucrose solutions the potato tissue sank to the bottom of the test tube indicating that the potato tissue was denser than the surrounding sucrose solutions. When the potato tissues were placed in the 0.8 and 1 molar sucrose solution the potato tissue partially floated indicating that the potato tissue was less dense than the surrounding sucrose solutions. However, after 24 hours I noticed that the potato tissues had sank to the bottom of the test tubes. My conclusion from this is that the loss of water and decrease in volume of the potato tissue both contributed to increasing the density of the potato tissue to an extent that the density of the potato tissue became greater than the density of the surrounding sucrose solution.
Evaluation
On the whole I believe that I carried out the experiment quite well. I tried to eliminate all of the variables in each experiment apart from the concentration of sucrose solution. From my observations of the results I have determined that Experiment 1 has some far more erratic results than Experiment 2. There are two easily identifiable anomalous results in Experiment 1 (see circled points on Figure 10). These anomalous results are averaged with the results of Experiment 2 and so have affected the graph illustrating the Average Percentage Change in Volume (Figure 11). I believe that the best-fit line of Average Percentage Change in Volume is considerably different from its true position due to the anomalous results. This is the reason why in analysis of the results I have chosen the value of 0.40 molar sucrose solution as being the point at which there is no net movement of water in or out of the potato tissue and why I have used the value of 0.40 as the point of equilibrium in the conclusion.
I believe that Experiment 1 has some more erratic results than Experiment 2 because I familiarised myself with the equipment and method more by the time I did Experiment 2.
I think that I could improve the accuracy of the observations and measurements of the investigation by:
- Using another method of measuring the initial and final readings
All of the readings are not as accurate as they can be. This is due to the limited measuring equipment that I used. A ruler is not the most ideal instrument to use. The use of callipers would be far more accurate. However, I believe that the most effective way of measuring the initial and final volume of the potato cores would be by water displacement. Of course there is the possibility that the water would affect the volume of the potato core. However, when you consider the crude methods that were used to measure them and the length of time that the potato cores have been immersed (24 hours), a 30 second dip in to a measuring cylinder full of water would be a great improvement.
- Increasing the number of Experiments
I could also have increased the number of times that I carried out the experiment. I would have more results to make the average graph so it would be more accurate.
- Increasing the number of solutions in each experiments
If I increased the number of solutions used in each experiment it would be far clearer to see any anomalous results and it would be far easier to draw the best-fit line. This would then help in the conclusion to estimate the point of equilibrium more accuracy and with greater certainty.
- Extending the period of time the potato cores are immersed
If the time period is increased then the change in volume maybe more profound. This would make observing and analysing the results easier.
I think that to extend the investigation I could have:
- Used different vegetables
I could have used other vegetables such as beetroot, turnips or even another variety of potato. There might have been a more profound difference in the results making them easier to analyse.
- Measure the weight of the potato core instead of the volume
This may prove to be a more effective way of observing the relationship between the solute concentration and the mass change rather than the volume change.
Since shells of onions are thin then I could cut a strip and place it in a petri dish with the solute concentrations in them. I could then simply measure the final and initial lengths of the samples rather than calculating they volume.
Overall, I feel that the conclusion I have drawn from my experiments verifies the predictions I made prior to carrying out the investigation. Further more I am sure that if the experiments were carried out with the improvements and extensions of the investigation as outlined above, the results obtained would give further credence to my conclusion.