I will endeavour to use the same volume of each liquid with each experiment that I undertake.
I will ensure that there are no bubbles of oxygen within the burette before I start, as this will alter the reading severely and cause many anomalous and out of place results.
I can also use various pieces of equipment to help me make the tests fair, such as the stop watch, the stop cock on the burette which must be securely fastened at all times to ensure that no unwanted air seeps in through the seal. Also when undertaking the experiment I will ensure that all of the windows are shut, as gusts of wind cannot only alter the temperature, but could also shake up liquids, and knock equipment off of the worktops, these could all affect the enzyme reaction. Thus leading me on to the list of possible variables that I could change and alter to further my experiment in different directions and extend my knowledge. These Possible variables are…
Heat Light Volume Time
PH Level Temperature Concentration Mass
For my Experiment I have chosen to alter the CONCENTRATION of the Hydrogen peroxide to see how that affects the rate of reaction when placed with the yeast in a test tube. I chose to alter the concentration, as this is the one variable that I believe would have the most varied results, and the one variable that would allow me to produce clearly definable results, and therefore make an appropriate conclusion. I did not choose to alter temperature because that would have been too difficult to control effectively, e.g. it is very hard to heat a test tube up to exactly 30ºc when the tube continues to heat up even after the Bunsen or other heating apparatus has been removed. As I would undertake if I were attempting the heat changing experiment to obtain a field of results over a wide range. The range that I am using will be fairly spread out. This is so that any anomalous results can be identified easily, then the experiment repeated if necessary. The ranges of concentrations that I am going to be using are 0.2, 0.4, 0.6, 0.8, and 1.0, (All concentrations are of Hydrogen Peroxide and are MOL dm-³
Predictions:
I now predict that I expect the time taken for the gas to form will decrease as the concentration increases. In other words this means that to increase the concentration, is to increase the rate of reaction considerably. I would also now expect that if the concentration was doubled, so too is that rate of reaction. I also now predict that as time increases within the reactions, the amount of collisions within the liquid of the particles will decrease, due to the fact that many of the particles within the liquid will have already collided and reacted.
Proving:
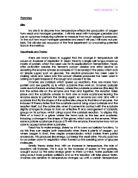
Enzyme molecules have a very specific method of converting those molecules upon which they work (the substrate molecules). Enzyme molecules are proteins that act as biological catalysts, so they are not themselves used up when converting substrate molecules. On every enzyme molecule is an active site where the substrate molecules are joined to the enzyme molecule, and converted to product molecules. Every enzyme is specifically shaped to fit that substrate upon which it works, and therefore they do not work in conditions that denature the molecules, (e.g. very high temps)
Diagram of how enzymes work:
The fastest known enzyme is catalase. Found in the liver where it speeds up the decomposition of hydrogen peroxide into water and oxygen, catalase has a turnover number (the number of substrate molecules which one molecule of enzymes turns into products per minute) of 6 million. Its action can be demonstrated by dropping a small piece of liver into… hydrogen peroxide: the fizzing that ensues as oxygen is given off is a dramatic demonstration of an enzyme in action.
-M.B.V Roberts, from the “ Biology A Functional Approach”
This is why I chose to use the catalase, as this is the only enzyme that would be fast enough to see in a lab and in the allotted time that I have.
The equation below shows the reaction that takes place when catalase is added to hydrogen peroxide.
Hydrogen peroxide → water + oxygen
2H2O2 → 2H2O + O2
Enzyme Catalase
This equation and some of the science behind it will take place in the experiment I shall do.
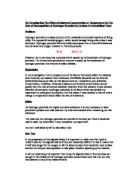
This Graph, obtained from "Biology a Functional Approach" clearly shows that the more concentrated the substrate the faster the reaction. The dots on the graph signify the points at which the catalase was tested.
I think that the predictions will be correct and will be proven so, due to the following reasons, the first being the Collision theory.
The Collision theory states that a chemical reaction can only occur between particles
when they collide (hit each other). Particles may be atoms, ions or molecules. There is a minimum amount of energy which colliding particles need in order to react with each other. If the colliding particles have less than this minimum energy,
then they just bounce off each other and no reaction occurs. This minimum energy is called the activation energy. The faster the particles are going, the more energy they have. Fast moving particles are more likely to react when they collide. You can make particles move more quickly by heating them up, (raising the temperature).
Secondly I believe that all of my predictions are correct, following information gained from “Biology For Life” By M.B.V Roberts, concerning active sites and timings.
When I observe the readings on the burette, I am going to repeat this experiment 3 times, but if my results appear inconsistent then I will keep repeating them until I have 3 similar readings to gain averages from. This so that any anomalies can be discarded and retaken, until correct averages can be taken.
For this experiment I also used knowledge gained from my preliminary work, with potato chips concerning masses. I found that when a potato was placed in Hydrogen peroxide and left, it began to react. I saw bubbles, which made me decide to collect the give me a means of measuring the reaction. I didn’t want to simply count the bubbles as they were all different sizes and I did not know how much of the gas each one contained. I could have used an upside down measuring cylinder to measure the gas content, but it is only accurate to 1.0cm³, so I therefore decided to use a burette, which is accurate to 0.1cm³.
Here are the Tables that I have recorded from undertaking my experiment. To the left on the tables, are the times, which are measured in seconds. The concentration is on the top of each table, i.e. 0.2, and underneath the letter corresponding to the experiment are the readings are of water left in burette, this has been measured in cm³. To obtain air produced, simply subtract the reading from 50, e.g. 50 – 48.9 = 1.1cm³ of oxygen produced at a given time.
Averages:
As these tables show, I repeated all of the experiments 3 times. This was necessary to allow any anomalies to be found and identified. I had originally planned to only undertake 2 tests on each concentration, but found that due to freak variables and accidents I had to repeat to obtain fair results. I used a burette so that I could be very accurate in obtaining my results. I also used a varied range of concentrations in my experiment; this range was obtained and adapted from my preliminary work as I found that to be a suitable range.
Graphs:
Analysis Of Graphs:
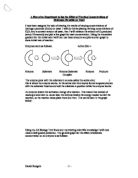
This graph shows how the time differentiates as the concentration increases. The trend line is not a straight line passing through the origin (the criteria for direct proportionality). It therefore simply shows that the time taken for a set volume of gas to evolve decreases as the concentration increases. This is what I predicted, and these results support that prediction reasonably well. The science behind this was outlined in the justification for my earlier predictions, and it links back to the Collision Theory: The time taken for the reaction to take place, or for the set volume of gas to be given off, becomes shorter for higher concentrations of enzyme. This is because higher concentrations of enzyme contain more enzyme molecules than the lower concentrations. Also, the graph curves off and reaches a plan towards the end of the reactions as the enzymes have reacted and all of the active sites have been used for reactions. If there are more molecules, then there are subsequently more collisions taking place over the period of a second (for e.g.). This means that more reactions between enzyme and substrate molecules take place in a second, and therefore the product (O2 in this case) is evolved more promptly. So at higher concentrations of enzyme solution, the oxygen is given off more rapidly because there are more enzyme molecules working on substrate molecules in a second. I think making predictions before undertaking an experiment, as it helped me to achieve a goal and gave me something to aim for, and helped me to prove how 1 molar is higher.
Evaluation:
As my graph shows, I encountered one large anomaly in my 0.2 mol dm-³ experiment on test B. I believe that this was due to the test tube being shaken up, and so altering the results very much. This is due to the kinetic energy gained by the molecules when it was being shaken up, so increasing the number of collisions within the liquid, increasing the reaction time. I think that most of the equipment that I used was suitable and accurate enough for my purpose; I can however suggest some changes for improvement. Firstly that the yeast should have been placed in the H2O2 in a more gentle and accurate fashion, as opposed to being squirted in with a pipette, other suggestions include…
- Temperature maintained better, i.e. Water bath.
- All experiments undertaken on the same day.
- Same batch of yeast each time.
- Ensure that no oxygen is left in the burette.
- Dry all of the test tubes before experiments begin.
- Do not let oxygen escape through bungs or any un-noticed holes.
- Squirt in yeast in at same pressure each time to ensure they all have the same kinetic energy when they heat the beaker sides and osmosis begins.
- Make sure that delivery tubes are all the same length so that oxygen does not have further to travel before being recorded by timer in burette.
- Keep Humidity the same throughout all the expts.
- Use a mechanical pipette to measure out solutions.
All anomalies are explained above, as directed. Using the experiments that I have carried out, I can now make a solid, firm conclusion based on evidence obtained, and that is that Rate of reaction ∝ Concentration, this can be seen in all of my tables (anomalies aforementioned), my graph and in my preliminary work from all text books, and internet sites listed in my bibliography. To say that the catalyst yeast’s reaction is sped up by a substrate is all well and good, but to support a firmer conclusion I will need to undertake more experiments to gain more evidence, to ensure that all of my work is valid and not anomalous, as methods such as using a buffer tablet to control the PH level do not always work.
Further Experiments-Extension:
If time permitted me to, then I would now test out different substrates on this catalyst. I could simply change the substrate, or I could dramatically change the concentration to see if they were in line with my original predictions made in the first experiment. With my previous experiment with H2O2 I could not get readings with the higher concentrations as they used up the oxygen too fast in the burette and I couldn’t get a reading. Using a very large burette could combat this. I could use dilute hydrochloric acid with the yeast to observe how that affected the timings of all the experiments. These may be undertaken at a later date.
Bibliography:
AS Biology.
Biology A functional Approach
Biology for life
Yahoo.com
Google.com
Edinburgh university.