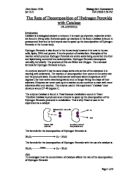
When any two reactants of equal amounts and of a full concentration are mixed together they both have a high chance of colliding with one another. However if the concentration of one reactant were to be reduced by 50%, a neutral substance would have to be introduced and fewer collisions would occur between the two reactants resulting in a slower decomposition time. Thus Yeast solution at 100% concentration has more chance of hitting Hydrogen Peroxide and the molecules entering the active sites of the enzymes and decomposing than Yeast solution at 50% concentration. The time taken for the decomposition of Hydrogen Peroxide with 100% Catalase would be half of the time with a 50% Catalase because there is half the number of catalase molecules hitting the hydrogen peroxide molecules. If there are more enzymes to the ml of Yeast Solution then there are more spaces for the molecules to go into enzymes. There will be a higher ratio of Catalase cells to hydrogen peroxide molecules with a higher concentration of Yeast and a lower ration with a lower concentration. Hence with a higher ratio the rate of decomposition will be quicker. The following diagrams help to explain the collision theory
Variables
The variables in the experiment are temperature, pH, volume, concentration and the time it takes to fill a 20 cm3 syringe to the 10cm3 mark.
The variables in the experiment I will keep constant are temperature, pH, volumes of substrate and enzymes and concentration of Hydrogen Peroxide. These are being kept constant as they speed up/or slow down the rate of decomposition of Hydrogen Peroxide.
The independent variable in the experiment will be concentration of Yeast. The Dependant variable in the experiment will be the time it takes to fill a 20cm3 syringe to the 10cm3 mark.
Trial
The method was carried out with concentrations of 10% and 100% yeast. The time taken for the syringe to fill up 20cm3 was recorded for each result. The results found were that at 10% it took 61 seconds and at 100% it took 38 seconds.
The trial experiment showed that the time taken to fill the 20cm3 was too long as at 10% the bubbles stopped being produced between 12 and 13cm3. As a result of this the trial was repeated measuring up to the 10cm3 mark on the syringe. This worked effectively at both concentrations. As the second attempt worked it can be assumed that the temperature is high enough to allow all the results to be found but low enough to avoid inaccuracies with the time being too quick. Therefore in the set up of the experiment no Bunsen burner will be required to heat the water bath.
From these results the range of the results to be used in the actual experiment can be decided. The results will range from 20% to 100% concentration and will be taken at intervals of 20%. These results will be repeated three times each.
Apparatus
Subaseal
2ml syringe - The most accurate for the 2ml of hydrogen peroxide used
1ml syringe - The most accurate for the 1ml of Yeast solution used
2 x Stand/Clamp
1000ml Beaker – Used as a water bath
200ml Beaker –Less likelihood of oxygen bubbles escaping while still being enough room to get equipment into the beaker, syringe/tube.
Delivery tube
2 x Clamp – To go around top of syringe – stop air bubbles escaping and around tube to stop flow of air bubbles into syringe.
Timer – With minutes and seconds – Split seconds cannot be accurately used when forming a conclusion from results.
Yeast solution
Hydrogen Peroxide
Distilled Water
Right Armed test tube
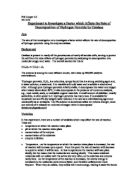
Diagram
Method
- Set up the apparatus as in the diagram
- Measure out the concentration of yeast solution to 1ml with the 1ml syringe i.e (0.8ml yeast, 0.2ml distilled water for 80%. 0.6ml, 0.4ml distilled water for 60%. Etc.)
- Place the 1ml solution into the test tube and then replace the bung.
- Measure out 2ml of hydrogen peroxide with the 5ml syringe and place in the bung.
- Start the timer when the hydrogen peroxide hits the yeast solution.
- When the 20cm3 syringe gets to the 10cm3 mark stop the timer and record the result.
- Repeat this for each percentage – 20%, 40%, 60%, 80%, and 100%.
- Repeat all of these 3 times.
Safety
The hydrogen peroxide needs to be treated with care in the experiment as it can bleach skin and clothing. Therefore eye protection should be worn and loose garments taken off.
Fair Test/ Accuracy
To ensure that it is a fair test the temperature of the water bath will be monitored throughout the experiment if it changes +/- 0.5 then it will be brought back up/down.
The volumes of the solutions will also be kept the same throughout the experiment to ensure a fair test.
Accuracy will be ensured by one person letting the hydrogen peroxide out of the syringe and the other watching for contact between the hydrogen peroxide and Yeast solution and starting the timer.
-Obtaining Evidence-
Time taken and rate of filling a 10cm3 syringe at different concentrations of yeast
Methods used to ensure accuracy
The data collected shows the time taken for oxygen to use up 10cm3 of the syringe. This shows how time is affected by different concentrations of yeast solutions. This also shows the rate at which hydrogen peroxide decomposes at different concentrations of Catalase (contained within yeast solution).
Accuracy
To ensure accuracy the timer was started when the hydrogen peroxide was released from the tip of the needle into the yeast solution. The time was then stopped when the bottom of the meniscus reaches the 10cm3 mark on the syringe. Both the starting and stopping of the timer was done by the same person (as different people’s reaction times could affect results), while a second person injected the hydrogen peroxide into the yeast solution. The eye level of the person timing the experiment was always level with either the meniscus or the needle tip depending on which part of the timing was being done.
To avoid inaccuracies between results apparatus was thoroughly cleaned after each result because traces of Hydrogen Peroxide or Yeast would have affected the outcome of the next result.
The temperature of the water bath (being a variable of the experiment) was constantly monitored throughout the experiment. The temperature during the experiment remained at a constant 27 (+/- 0.5) degrees C and therefore did not need to be altered. Finally to maintain accuracy the same apparatus was used in each set of results.
- Analysis -
The experiment shows that as the concentration goes down the rate goes down i.e. that it is slower. It also shows that as concentration goes down the time taken to fill the syringe goes up.
Calculations on Data
The in the tables has been looked at and the results for trial 1 appear very different to those in trials 2 and 3. For this reason an average has been taken of trials 2 and 3 and trial 1 has been left on its own. Rate has also been calculated for the average of trials 2 and 3 and for trial 1.
Rate was calculated using the following method of:
Rate = 1 .
Time
Another way of calculating the value of this is using the formula:
Rate = Volume
Time
However these results give the same trend of data despite them having different numerical values.
The rates were calculated as they show a direct proportion to the concentration; concentration being directly proportional to Rate on Graphs 2 and 4 i.e. as the concentration of catalase used in the experiment increases the rate of decomposition of the Hydrogen Peroxide increases. The gradient of the line here is approximately 0.06. This means that for every percent increase of concentration the rate of decomposition will increase by 0.06. The values used here are only rough approximations taken from the graph 2 – the more accurate of the two graphs. Gradient was found by Vertical on the graph divided by horizontal on the graph.
The graphs show that both the time and the rate of the decomposition of Hydrogen Peroxide are proportional to the concentration of the catalyst used. The rate however is directly proportional – so if the concentration is increased by 1 the rate of decomposition will increase by a fixed amount, this about 0.06 in the case of this experiment. Time is also proportional and the exponential curve represents an approximate pattern that as concentration doubles then the time taken to decompose will halve and vice versa.
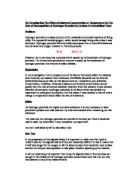
What is shown in the graphs can be backed up by the following scientific evidence based on the collision theory. When two 100% concentration molecules are together they have an equal chance of colliding and reacting or decomposing in this case. So with a 100% concentration catalyst – Catalase and a 100% concentration substance – Hydrogen Peroxide, the time taken for the Hydrogen Peroxide catalysing and decomposing is twice the time taken for Hydrogen Peroxide at 100% catalysing with Catalase at 50%; This is because there is another substance involved in the collisions – water.
This is shown more clearly in the diagrams below:
The conclusion has supported the prediction. As the conclusion shows that as the concentration goes up the rate and time taken for the decomposition of Hydrogen Peroxide will also go up. The conclusion also shows the quantative prediction to be true. That as the concentration of the Catalase doubles the time taken for the decomposition will halve. This is shown by the exponential curve on the graph. Rate has also been shown to be directly proportional to the concentration of Catalase by the straight line on the rate/concentration graph. My prediction was correct because the experiment uses the collision theory and how reaction time is affected by concentration.
- Evaluation -
The procedure used was adequate in getting the results found although if more time has been given the accuracy of results may have been better.
There were a few anomalies found in this experiment