To investigate the factors of the enzyme hydrogen peroxidase (catalase)
To investigate the factors of the enzyme hydrogen peroxidase (catalase)
Planning
Scientific Knowledge
A catalase is 'an enzyme found in the blood and in most living cells that catalyses the decomposition of hydrogen peroxide into water and oxygen (Student Reference Library 1992)
The Oxford Interactive Encyclopedia, 1997, describes hydrogen peroxide as 'a colourless liquid which is miscible with water... It decomposes on heating, or in the presence of a catalyst, giving water and oxygen.'
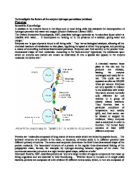
Enzymes are 'a type of protein found in all living cells.' They 'act as biological catalysts, allowing all the chemical reactions of metabolism to take place, regulating the speed at which they progress, and providing a means of controlling individual biochemical pathways. Enzymes owe their activity to the precise three-dimensional shape of their molecules. According to the 'lock-and-key' hypothesis, the substances upon which an enzyme acts (which are known as substrates) fit into a special slot (space) in the enzyme molecule: the active site':
A chemical reaction takes place at this site and the products are released, leaving the enzyme unchanged and ready for re-use. This cycle can be repeated as often as 100,000 times per second. Enzymes are very specific in relation to the substrates with which they work, and are normally only effective for one reaction or a group of closely related reactions. They function best in particular conditions of temperature and acidity (pH), and their action can be slowed or stopped by inhibitors. Many enzymes need a coenzyme in order to function. The human body contains at least 1,000 different enzymes.'
Proteins are 'molecules composed of long chains of amino acids which are linked by peptide bonds... The 'primary' structure of a protein is the order, or sequence, of amino acids in it; different proteins have different primary structures. The amino acid sequence determines the final three-dimensional shape of the protein molecule. The 'secondary' structure of a protein is the regular three-dimensional folding of the polypeptide chain, formed, for example, by hydrogen-bonding between regions of the chain. The commonest secondary structure is a right-handed spiral shape, called an a-helix'
Microsoft Encarta, 1997, describes proteins as 'any of a large number of organic compounds that make up living organisms and are essential to their functioning... Whether found in humans or in single celled bacteria, proteins are composed of units of about 20 different amino acids, which, in turn are composed of carbon, hydrogen, oxygen, nitrogen, and sometimes sulfur. In a protein molecule these acids form peptide bonds - bonds between amino and carboxyl (COOH) groups - in long strands (polypeptide chains). The almost numberless combinations in which the acids line up, and the helical and globular shapes into which the strands coil, help to explain the great diversity of tasks tat proteins perform in living matter.'
The amino acids are an 'important class of organic compounds that contain both the amino (-NH ) and carboxyl ( COOH) groups. Of these acids, 20 serve as the building blocks of proteins. Known s the standard, or alpha, amino acids, they comprise alanine, arginine, asparagine, aspartic acid, cysteine, glutamic acid, glutamine, glycine, histidine, isoleucine, leucine, lysine, methionine, phenylalanine, proline, serine, theronine, tryptophan, tyrosine, and valine. All 20 are constructed according to a general formula:
As the formula shows, the amino and carboxyl groups are both attached to a single carbon atom, which is called the alpha carbon atom. Attached to the carbon atom is a variable group (R); it is in their R groups that the molecules of the 20 standard amino acids differ from one another. In the simplest of the acids, glycine, the R consists of a single hydrogen atom. Other amino acids have more complex R groups that contain carbon as well as hydrogen and may include oxygen, nitrogen, or sulphur as well.
When a living cell makes protein, the carboxyl group of one amino acid is linked to the amino group of another to form a peptide bond':
'The carboxyl group of the second amino acid is linked to the amino group of a third, and so on, until a long chain is produced. This chainlike molecule, which may contain from 50 to several hundred amino acid subunits, is called a polypeptide. A protein may be formed of a single polypeptide chain, or it may consist of several such chains held together by weak molecular bonds. Each protein is formed according to a precise set of instructions contained within the nucleic acid, which is the genetic material of the cell. These instructions determine which of the 20 standard amino acids are to be incorporated into the protein, and in what sequence. The R groups of the amino acid subunits determine the final shape of the protein and its chemical properties; an extraordinary variety of proteins can be produced from the same 20 subunits.'
To test the factors that affect the catalase I have to identify them, these can be found in the collision theory. Basically, collision theory says that two reactants require collisions between particles for a reaction to take place. The rate of the reaction then depends on how often and how hard the reacting particles collide with each other. More collisions increase the rate of reaction. Below are four methods of increasing the rate of reaction, each are explained.
. Temperature
When the temperature is increased so is the amount of kinetic energy within the particles. This ...
This is a preview of the whole essay
To test the factors that affect the catalase I have to identify them, these can be found in the collision theory. Basically, collision theory says that two reactants require collisions between particles for a reaction to take place. The rate of the reaction then depends on how often and how hard the reacting particles collide with each other. More collisions increase the rate of reaction. Below are four methods of increasing the rate of reaction, each are explained.
. Temperature
When the temperature is increased so is the amount of kinetic energy within the particles. This increase in movement causes the particles to collide more therefore causing a faster reaction rate.
2. Concentration
If a solution is more concentrated, it means there are more particles of reactant between other molecules. This makes collisions more likely and increases the rate of the reaction. In a gas, increasing the pressure causes the molecules to become closer together, therefore causing more collisions
3. Size of solid particles (surface area)
By breaking up a solid into smaller pieces its surface area increases. This means that the particles in the solution have more area to react with so the number of collisions increases as does the reaction rate.
4. Catalyst
A catalyst speeds up a reaction but is not used up it self. A catalyst works by giving the reacting particles a surface area to stick to where they can bump into each other. This increases the number of collisions and the rate of the reaction.
However the rate of reaction, or the reaction itself, can be changed due to denaturation. Denaturation is 'the change that occurs in proteins and nucleic acids when they are exposed to temperature and acidity conditions outside their normal range or to some other chemicals. In the case of DNA, it involves the separation of strands in the normally double-stranded structure. In the case of proteins it involves an alteration of the three-dimensional shape of the molecule which is so important to its normal function. In the case of enzyme denaturation, the precise shape of the active site is altered so that the substrate molecules no longer fit and the catalytic action of the enzyme is destroyed. Denaturation is often a reversible process, as separated DNA strands can re-associate under suitable conditions, and similarly, many proteins can re-fold into their working shape if their chemical environment is correct.' (The Oxford Interactive Encyclopedia, 1997).
List of variables
Many factors can affect how fast a reaction takes place. This includes the temperature, catalyst, concentrations of reactants, pressure, surface area and whether or not the reactants are stirred.
Fair Test
In this experiment I will be seeing how the concentration of the hydrogen peroxide affects the rate of reaction between itself and the catalase. This means that all the other factors have to be kept about the same, so that they do not affect the experiment that is taking place. This includes the temperature, catalyst and its amount, the pressure on the reaction, the surface area of the catalase and whether or not the mixture is stirred. The catalase I will be getting from celery, because all living things contain hydrogen peroxidase. The amount of celery has got to be kept the same for each time I do the experiment as otherwise the test will be unfair, because the more celery there is the more enzymes there are and therefore the faster the reaction takes place thereby fluctuating the results.
Also the amount of hydrogen peroxide, whatever the concentration, must be kept the same for each time I do the experiment, so that it doesn't create any extra particles for the catalase to react with.
Variable changes and ranges
To see how the concentration of hydrogen peroxide makes a difference to the catalase I will have to change that concentration from a volume of 10, to 7.5 voles, 5 voles, 2.5 voles and 1.25 voles.
Predictions
I already know from previous scientific knowledge that when the catalase reacts with hydrogen peroxide, oxygen and water will be given off. The catalase or celery is acting as the enzyme, (made of a protein, which is made of amino acids joined by peptide and polypeptide bonds) which means that it is going to speed up the normal break down of hydrogen peroxide.
In this experiment I am having to look at the factors that affect the reaction. The factor that I have said already that I will be looking at is the concentration of the hydrogen peroxide. If the concentration is strong then there will be more particles of reactant in it making collisions more likely. And, the more collisions the faster the reaction takes place.
The diagram below helps to explain this better:
This all means that eventually my results should look something like that seen below:
The graph demonstrates that as the volume goes up so does the amount of gas collected. The first reaction, with 10v and the catalase, should take place the fastest. Then the second reaction with the 7.5v and then the 5v, 2.5v, and 1.25v finally should have the slowest reaction time. I predict this because I know that the higher the concentration the faster a reaction takes place, because there are more particles of reactant to collide with each other. This all means that the 10voles should have the most gas collected and the 1.25 will have the lowest amount collected.
I am going to do the experiment twice so I can get two sets of readings for the different volumes of H O . The results should be similar, because I would have used the same amount of celery and the same amount of hydrogen peroxide. Which should give me the same amount of enzymes and hydrogen peroxide molecules colliding together and hence the same results.
If the hydrogen peroxide was to be too strong then the reaction probably would not take place at all. This would be because enzymes need to remain in certain acidity levels and temperatures. If the levels of either of these are too high then the enzyme changes shape, disallowing the protein substrates to fit into the enzymes active site.
I just have to be careful that no other factor is present because this will affect my results.
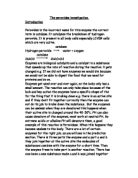
Apparatus
The apparatus that I will be using is hydrogen peroxidase found in celery, hydrogen peroxide, conical flask, burette, connecting tube, measuring cylinders, water bath, water, weighing scales, clamp stand and a stop watch.
Obtaining
Diagram
Method
To get an idea of the right amounts of celery and hydrogen peroxide needed, I had to put together any odd amount. I chose to use 50ml of hydrogen peroxide and 3g of celery. I put the celery into the conical flask and held the 1.25v of hydrogen peroxide in the measuring cylinder. After setting up all the equipment, so that the burette was held by the stand and was in the water bath half full with water, I had to pour the hydrogen peroxide into the flask. I poured it in and placed the bung on quickly, in case of it reacting and releasing oxygen before I could collect it. I had decided to count the amount of oxygen collected in the burette every 30 seconds for 8 minutes. However, there was no visible reaction not even after 3 minutes so I decided to change the amounts of celery and hydrogen peroxide.
I changed the amount of celery to 5g and changed the hydrogen peroxide to 30ml, from 50. The change in the amounts had to take place so that the reaction would take place faster but this couldn't be too large a change because the 1.25v is supposed to be quite slow. If I changed the amounts so much that the 1.25v was going fast then the 10v would have gone too fast.
30ml of hydrogen peroxide and 5g of celery did indeed seem the right amounts as the reaction went steadily. Next I redid the experiment but with the 2.5v, and then the 5v, 7.5v and lastly the 10v. When a reaction went so fast that it filled the burette before all the readings had been taken, the connecting tube had to be transferred into another burette. The readings were then continued by adding on the amount of oxygen collected every 30 seconds to that collected altogether in the first tube.
I redid the whole experiment with the different volumes of hydrogen peroxide so that an average could be taken.
Results tables
Volumes of H O
Time
.25v
2.5v
5v
7.5v
0v
30s
.8
3
0
1
2
m
3.9
7
3.5
4.5
5.7
.30s
5.6
3.8
6.9
8.3
20.1
2m
6.4
7
9.7
22.5
24.9
2.30s
7.7
20.2
22.8
24.2
27
3m
8.6
21.7
26.8
28.2
30.5
3.30s
9.3
24
29.2
31.3
33.2
4m
0.4
26.8
32.4
34.5
36
4.30s
1.4
28.9
34.5
36.3
38.6
5m
2.7
31.5
36.7
38.6
40.9
5.30s
3.6
33.7
40
42.1
44
6m
4.1
35.2
43.7
45.3
47.1
6.30s
5
35.9
46.8
47.9
49.2
7m
6.1
36.7
48.8
50.2
52.1
7.30s
6.9
37.6
50.9
52.3
55
8m
7.9
38.2
52.3
55.3
57.4
First set of results
Second set of results
Volumes of H O
Time
.25v
2.5v
5v
7.5
0v
30s
.5
4
9
2.4
5
m
3.2
0
3.2
5.7
7.9
.30s
5.2
4.8
7.3
9.8
22.9
2m
6.5
8
20.5
23.6
26.8
2.30s
7.5
21.5
23.8
25.6
28.7
3m
8.8
23.2
26
28.7
31.3
3.30s
9.5
26
29.3
32
35
4m
0.5
28.7
32.2
35.8
37.1
4.30s
1.2
30
34.5
37.6
39.2
5m
2.2
32
37.4
39.2
41.9
5.30s
3
33.5
40
43.2
44.3
6m
3.8
34
42
46.2
47.5
6.30s
4.5
34.9
44.8
48
51
7m
5.2
35.4
47
52
54.2
7.30s
6
36
48.9
53.1
55.8
8m
6.8
36.8
50.5
55.8
58
Analysis
Results graphs
The first graph shows both the first and the second set of readings I have taken, and the second graph shows the average readings of these results. The obvious pattern in the results can be seen and support my earlier prediction that "as the volume goes up so does the amount of gas collected". In both results the amount of gas collected altogether, from the different volumes of hydrogen peroxide, grows from the 1.25v to the 10v of H O . The graph I had drawn to show my expectations corresponds to the results graph. The line for the 1.25 vols does go up the slowest and after 8 minutes has the lowest amount of gas collected, while the 10 vols goes up the fastest and has the highest amount of gas collected. The graph shows a positive correlation between the concentration and the amount of oxygen produced. I know why all this happens from the background knowledge gathered earlier.
Celery has within it the enzyme hydrogen peroxidase, which every living thing contains. It is able to break down hydrogen peroxide by a 'lock and key' reaction. The catalase acts as the lock and is made of amino acids joined by peptide bonds. The hydrogen peroxide is the key that works only in that lock. The H O substrate fits into the active site, the bonds are broken, and the outcome is both oxygen and water. When the volume was strengthened it meant that there was more hydrogen peroxide for the enzymes to collide and act with. This logically means that there would thus have been an increase in the amount of gas collected. The enzymes themselves can keep on working, so if there is more hydrogen peroxide there to break down then the enzymes will do just that.
The diagrams below help to explain this more clearly:
Key
H O molecules
Enzyme (in celery)
I had expected my first set of results to be very similar to my second but they weren't. I had collected more oxygen from the second readings, of all the different volumes of hydrogen peroxide, than I had for the first. This is because, for the first set of readings I had used freshly cut celery and for the second set I had used the same celery, but hours later making it old. This meant that there was a whole lot more enzymes working in the first set of reactions that there was for the second, which will explain why my first lot of readings were higher.
More enzymes means an increase in the chance of collisions between itself and a hydrogen peroxide molecule, therefore allowing more of the hydrogen peroxide to be broken down within a short amount of time. This therefore explains why my first lot of results were higher. However if I had let both the experiments continue until all the hydrogen peroxide was broken down in them, I probably would have then found the results to be similar. The difference would have been that for the first lot I would have collected the full amount of oxygen in a shorter time, because there were more collisions and reactions taking place due to the larger number of enzymes. The older celery had contained fewer enzymes because it was dying, which meant that the enzymes too were dying, therefore reducing the amount of enzymes to break down the hydrogen peroxide.
From looking at my results and my previous knowledge I have formed a conclusion that the amount of enzymes affects the reaction times only while the amount of hydrogen peroxide affects the reaction times and how much oxygen and water is given out.
Diagram to explain and show hypothesis better:
Evaluation
The results I gathered came from the reaction of hydrogen peroxide and hydrogen peroxidase to form water and oxygen, the latter of which were my results. The amount of gas collected was measured in a burette every 30 seconds for 8 minutes. I could have taken the measurements every minute instead of every thirty seconds, which probably would have been better, as the extra readings do not really make an impact on the results I obtained and they also came too fast.
My results I feel are accurate and reliable to a high degree. The difference in the amount of gas collected for one set of results compared to another is only slight, as can be seen in the table. However the graph has highlighted some "anomalies" that I was not expecting. I have circled the points as anomalies because they do not fall on the lines of best fit. I think though that I understand why the results are not quite as I expected.
If the points on the graph for each different vole of hydrogen peroxide were joined, sometimes a curve can be seen rather than the line that I have drawn by doing the line of best fit. I will go back to the graph to draw these lines.
I should have been expecting these curves according to the Biology Of Science 1 and 2, 1998, which says that:
The 'effect of [a] substrate concentration on the rate of an enzyme-controlled reaction' should look like the graph below-
The explanation for the graph is also given, and this explains why the graph for the concentration of H O should in fact be curved:
'For a given enzyme concentration, the rate of an enzyme reaction increases with increasing substrate concentration (fig 4.7). The theoretical maximum rate (Vmax) is never quite obtained, but there comes a point when any further increase in substrate concentration produces no significant change in reaction rate. This is because at high substrate concentrations the active sites of the enzyme molecules at any given moment are virtually saturated with substrate. Thus any extra substrate has to wit until the enzyme/substrate complex has released the products before it may itself enter the active site of the enzyme.'
However, I did not obtain obvious curves for all the results. That may be because I did not take the measurements over a long enough period or because of slight inaccuracies in writing down the results. Also, at times the celery was not cut to such small sizes as other times, which would make a difference to the rate of reaction because the larger a surface area is the more collisions there are and the higher the rate of reaction. If I were to redo this experiment I would make sure that all the celery was cut to a similar size, because then my readings would not have been affected and all the lines on the graph would have been curves rather than a few.
To further the work on factors that affect the rate of reaction between a catalase and hydrogen peroxide I would check other factors. I have already proved that the concentration affects the rate of the reaction, and have seen basically that so does the surface area. Now all that needs investigating is the pH, temperature, stirring, pressure and the catalase amount. But I am sure that these affect the rate of reaction too.