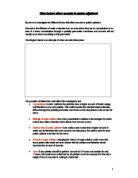
Before starting the investigation, I carried out preliminary work on the strength of sugar solution and the effect it had on visking tubing. Visking tubing is a partially permeable membrane and it does not let sugar molecules diffuse through it.
The diagram above shows that in boiling tube A the water from the 0.0M solution in the boiling tube diffused into the visking tubing containing sugar solution. This is because there is a higher concentration of water in the boiling tube and a lower concentration of water in the visking tubing. The visking tubing then expanded because it was gaining water and turned turgid. In boiling tube B the water in the visking tubing will diffuse into the boiling tube containing sugar solution. This is because there is a lower concentration of water in the boiling tube and a higher concentration of water in the visking tubing. The visking tubing in boiling tube B shrank as there was a loss of water and it become flaccid.
This preliminary work also helped me to decide on the range of sugar solutions I will use for my actual experiment. My range of input variables will be solutions of strengths 0.0M, 0.25M, 0.5M, 0.75M and 1M, they increase by 25 each time and will be a broad enough range to show a significant pattern. I can also start to observe from the preliminary work that some of the potato cylinders in a certain solution would possibly become turgid or flaccid similarly to the potato cylinders in the preliminary work. The visking tubing in the preliminary experiment expanded in the 0.0M solution and shrinked in the 1.0M solution.
From my knowledge of osmosis and the results from my preliminary work, I predict that a potato cylinder in a 0.0M sugar solution would gain the most weight. This is because there would be more water in the test tube and less water in the potato cylinder so the water would diffuse from a place where it is in high concentration to as pace where it is in lower concentration, this osmosis occurs. I also predict that a potato cylinder in a 1M solution would lose the most weight because there would be less water in the test tube, causing osmosis to happen and the water to diffuse from the potato cylinder into the test tube. Due to this, as I test five different strengths of sugar solutions 0.0M, 0.25M, 0.50M, 0.75M and 1.0M, I expect to see the weight change decrease.
The following apparatus will be used in this experiment:
- Cork borer- size 6
- Cutting tile
- Beakers
- Boiling tubes
- Knife
- Electronic top-pan balance
- Tube Rack
The following method was used during the experiment:
- Using a Cork Borer, of size 6, dig firmly into the potato to get equal 5 potato cylinders of the same diameter.
- Then, using a knife and a steel rule cut each cylinder to a length of 5cm, on a cutting tile, also making sure there is no potato skin.
- Next, dry the potato cylinders with tissue paper and then weight of each of the five potato cylinders were measured individually using an electronic top-pan balance.
- Into the five different boiling tubes, one potato cylinder was placed.
- Then, some of each sugar solution, of strengths 0.0M, 0.25M, 0.50M, 0.75M and 1M, was poured into each boiling tube so that the solution covered the entire cylinder.
- Each boiling tube was then labeled according to what sugar solution was poured into it.
- All five boiling tubes were then left in a tube rack for 24 hours.
- After this period the weight of each potato cylinder was measured again using an electronic balance and recorded to two decimal places.
Diagram of the experiment:
I then conducted my experiment.
The weight change is found by taking away the ‘weight of the potato after 24 hours’ from the ‘weight of the potato cylinder at the start’.
After carrying out my actual investigational experiment, the results for the investigation are as follows:
The graph on the next page (5a), shows the relationship between the strength of sugar solution and weight change from the data collected in the table above.
From the graph I can see that the prediction made is supported by the evidence obtained from this investigation and as the strength of the sugar solution increases, the weight of potato cylinder decreases. This shows that the strength of sugar solution is a variable which does affect osmosis in potato cylinders. My results support my prediction because like I hypothesised: The potato cylinder in the 0.0M solution gained the most weight, this was because it was in the weakest solution. The potato cylinder in the 1M solution lost the most weight, this was because it was in the strongest solution. Osmosis occurred in the cylinder containing 0.0M, the water molecules diffused from the tube, into the potato cylinder because there was less water in the potato then in the tube. This is in opposite with the potato cylinder in the 1M solution. The cylinder in the 1M solution loss the most weight. There was more water in the cylinder and less water in the potato cylinder so osmosis occurred as the water molecules diffused from the potato cylinder into the surrounding area. This proves I was also correct in saying that the weight change would decrease as I increased the strength of the sugar solutions by 25 each time (starting from 0.0M and stopping at 1M).
I have also noticed that my predicted graph was slightly similar to the actual graph, as the direction in both graphs is decreasing in a steep slope, and the weight change decreases as the strength of sugar solution increases. However the line of best fit on the actual graph is curved and goes beyond 0.0 into the negative region of the graph, which I did not predict would happen.
The procedure for this experiment was fairly straightforward and using my method I was able to gather a reasonable amount of evidence to notice relevant patterns. My method was also suitable but could have been improved by possibly using a micrometer to measure the exact diameter of each potato cylinder used in the experiment. I could have also measured the exact amount in cm³ of the amount of solution poured into each boiling tube rather than estimating, and I could have done the same investigation several more times and then used this overall average. All these things would have increased the accuracy of my experiment and made it a fairer test.
However, my results seem to be accurate and there are no anomalous results according to my line of best fit on my graph. This means there was possibly the least amount of experimental errors during my experiment. Yet, some of the possible experimental errors could have been accounted for or caused by using an unequal amount of solution in each boiling tube and the strength of the solutions may not have been composed exactly correct.
To further my investigation and to provide me with additional relevant evidence and data I could have investigated osmosis in a narrower range of sugar solutions: As the line of best fit goes into 0.25M on my graph, meaning the weight change for 0.25M was 0g and no osmosis took place, I could have investigated osmosis in smaller graduations, between 0.0M and 0.25M (e.g. 0.05M, 0.10M, 0.15M, 0.20M).This would have helped me to find out which sugar solution had the same molarity as the potato cylinder, according to my graph and procedure.
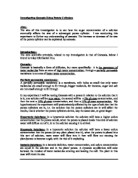
On the next page (6a), there is an extract from a textbook which describes the process of osmosis and what generally usually happens during osmosis. Comparing my results to this information the results I have found during my investigation do seem to be along the right lines and show that I have found enough evidence from this experiment to support a firm conclusion and also show they are reliable.
From the textbook ‘Heinemann Advanced Science’ by Ann Fullick (page 53, chapter 1.4 - Cellular processes).