If we look at the figures of revenue from income tax, we can observe that it remained stable throughout the years, reaching a peak in the late seventies and decreasing at a moderate pace after. National insurance contribution varied in the range of 30 – 37% of total revenue. This can be seen in Appendix 1. In the nineties there was increased importance of licenses, taxes and fines. On the other hand, revenue from Customs and Excise, which was significant in the eighties and in the seventies, began to lose its share in the early nineties. In fact as we see in Appendix 1 Customs and Excise collapsed to 8% in the mid-nineties, when VAT replaced it. In our analysis we don’t have the figures for the later years where we suppose that the removal of Vat in 1997 would have increased Customs and Excise values for the years following until the Introduction of VAT that was brought in the last election when the Nationalist party was appointed.
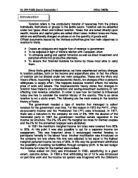
We can observe a graph showing the total revenue collected in taxation in the following country.
The graph shows the continuous growth in total tax revenue collected by the government from 1971 to 1995.
In order to analyse the tax burden in Malta we have to be able to analyse if the Maltese economy is overtaxed or not. If we therefore speak of overtaxed economy we are implying that there exists an “optimal’ tax. This tax can be used as a yardstick for reasons of comparison. In 1945 an economist named Clarke attempted to determine this rate. Together with Keynes, Clarke suggested that when total taxation exceeded 25 % of Gross Domestic Product (GDP), ‘ damaging pressures’ would follow. So we can explain this 25 % as the limit that an economy is able to support.
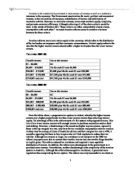
This concept of having a limit, after which ‘damaging pressures’ may crop up, is also found in the Laffer curve. Arthur Laffer derived this in the 1970’s. The relationship that he focused was the one between tax revenue and tax rates. This can be shown in the figure below.
Laffer curve
The principal rationale underlying the Laffer curve, is that the optimal tax rate is that rate which maximizes tax revenue for the state. This is point M in the diagram. Below the optimal tax rate, an increase in the tax rate increase tax revenue, whereas above the optimal tax rate, an increase in the tax rate reduces tax revenue. This happens since higher rates discourage productive efforts. Being derived intertemporally, the Laffer curve assumes that the optimal tax rate is consistent overtime, and that such optimal tax rate corresponds to a maximum level of tax revenue, which is also by implication consistent over time. The optimal tax rate corresponds to a particular level of GDP that is consistent over time. However we know that a developing economy tends to grow over time. In fact the economy is continuously subject to trade cycle fluctuations, which influence the overall performance of the economy. This shows that the Laffer curve could be considered being a simplistic approach.
During the period 1960-1980, research of the Maltese scenario has suggested that the tax rate index and tax revenue were positively related and upward moving. If we transfer this analysis to the “Laffer curve” analysis we can say that the, Maltese economy was still below the maximum rate M. Therefore according to theory a rise in tax rates could yield additional revenues. In an analysis on the data of the Organization for Cooperation and Development (OECD), Michael Beenstock extrapolated a linear function, correlating the average tax rate and the GNP per head. In this way we can compare Malta’s past tax indices with those for Europe. In 1976, According to these calculations, Malta obtained a 26% rate of tax. The actual rate was 24 %. This means that tax rate was 2 points below the OECD average. From these results we can say that Malta’s tax rate was considered to be fair from an international point of view.
In order to judge critically the overall tax burden in Malta there exists mainly two methods. The first method refers to a time serious analysis. This method consists of acquiring data from the Maltese scenario and making an intertemporal analysis using statistical techniques known as regression analysis. The other method consists of an international comparison. In this case one can also use regression techniques in order to derive an internationally equivalent tax rate for the Maltese economy for the year 1994.
A country’s tax burden is estimated by dividing the total amount of taxes paid by the GDP, that is, (sigma) sigma taxes /GDP). If we consider the international tax structure, studies have indicated the existence of a progressive element. This means that richer countries pay proportionally more tax than the less well-off (Delia 1982). So we can fit a regression line relating a country’s tax burden to its GDP per capita, using data for different countries. The countries chosen are OECD countries. The following data for the OECD countries is shown below.
We can plot the data and see the various GDP’s at current prices of the countries for different tax rates selected.
So the rate formula can be a linear equation:
T = bo - b1Y
Where T = tax rate
Y = GDP per capita in terms of a common numeraire (Us Dollars)
The different GDP’s per capita are expressed in a single currency in order to facilitate comparability. At this point if we want to compare Malta’s tax index with other countries in a particular year, we must calculate the regression line for these countries, obviously excluding Malta. The equation that we obtained is used in such a way as to extrapolate the tax burden for Malta. The resulting outcome can be seen in the Appendix. The following were the results of the regression.
T = 32.47 – 0.00041Y
t- statistic (8.39) (2.36)
r2 = 0.26
F = 5.55
N = 18
In this analysis, some OECD countries were excluded. These were economies like Australia, Canada, Japan, New Zealand and the U.S.A. This was done to have a more “ true” comparison. However it could be argued that the countries utilized for this comparison are different from Malta. These countries were chosen since they are first of all European countries. Moreover they are considered to be less than “mature”. In fact these countries are characterized by a strong government sector, directly involved in production and in Welfare redistribution programmers. It is known to all of us that European governments are more prone to intervene in the market mechanism then governments like U.S.A and Canada. In this sense Malta is similar to the countries chosen.
If we look at the statistical results, we find that the estimates of the coefficients were satisfactory on the whole. Both the t- statistic and the f- statistic calculated are statistically significant at the 95% confidence level. As regards the
r2 we can say that 26% of the variations in tax burden, can be attributed to the tax rate and G.D.P per capita. The rest being explained by other factors not captured by the data. The above equation will be now used in order to find the tax rate for Malta using international comparison.
Given Malta’s G.D.P per capita at current market prices and the exchange rate together with estimate of population we can identify the international tax burden.
GDP.(Exchange rate)
Population
LM 1019,200,000*2.6486
369,400
The answer is $7,307.67
If we substitute this figure for Y in equation T = 32.47 – 0.00041Y we get:
T = 32.47 –0.0041*7,307.67
= 32.47 – 2.996
= 35.47%
In 1994 the tax rate was the following:
Total Tax Revenue
GDP
LM 307,701,000
Lm 1,019200,000,
The answer is 30.19%
This means that the Maltese economy was not overtaxed in this specified period.
Underground economy refers to illegal market activities and legal productive activities, which citizens intentionally do not report and which are therefore not included in official reported GDP estimates. The best example of illegal market is the one for hard drugs such as heroin and cocaine. These represent real production even though society does not generally regard these things as ‘ goods’. This, together with other illegal activities generates income but often goes unreported to the tax office. In other cases citizens do not report activities. This occurs in order not to pay taxes. One good example could be the plumber doing some work at a house and who gets paid without declaring anything.
Due to these activities GDP statistics are often underestimated. Tax rate increases could make activities, such as the under or undeclared income more attractive. What is essential to say is that this underground economy distorts GDP estimate. As a consequence both GDP and tax revenue measurements would be undervalued resulting in a misleading tax index. The argument follows that these people carrying out transactions in the underground economy would have a lower tax burden than it should.
If we recall the formula to calculate tax burden (i.e. tax paid/ estimated GDP) we see that both the numerator and denominator would be affected by underground economy. So the ideal situation would be to calculate this amount of underground economy. However this is difficult to measure providing a satisfactory amount of certainty, since, the very nature of such activities are kept under cover. Research in this subject in Malta has been limited. In 1985 Mr. M .Micallef showed that the underground economy had by 1985 grown roughly to LM 63.5 or 22% of reported GNP.
The introduction of VAT in 1995 captures a lot of economic activity that was conducted in the informal sector of the economy. This occurred since businesses were obliged to regularize their position. Thus, the 9.1% growth in GDP at factor cost in 1995 over 94 was particularly caused by the surfacing of underground economy. In fact, around 2% of the real GDP growth, has been attributed to such activity. The economic activity captured in the formal sector in 1995 is an indication that the GDP and tax revenue estimates used in the calculation of tax burden previously are undervalued. The final effect on the local tax burden would, nevertheless, depend on the rate at which this increased income is taxed.
Another factor that will heavily influence the impressions of the overall tax burden is the administration of tax regimes. It could be that a country that has taxes, which are not called, taxes but that in fact act as a real tax. In Malta one of the best-known example was the tax on saving and the strict Exchange controls. If we look what happened during the years in Malta we can observe several of these instances. In 1979 a Price stabilization scheme was set up with the objective of stabilizing over time the prices of such basic commodities as bread, meet and sugar. Some of these commodities were taxed, while others subsidized. If expenditures on subsidies exceeded receipts from levies, the difference was financed by this fund. However throughout the years, the tendency was that the differential was added to total government revenue and used for other purposes rather than stabilizing food products. Therefore we can consider these levies to be an ‘indirect’ form of taxation. Also countries make use of tax aid to achieve aspects of government policy that can affect tax-toGDP ratio. An example of this is family allowances. These are granted through the tax system and therefore according to statistics ,less revenue is collected from taxes than would be the case if the allowances were paid as cash transfers to household and financed out of tax revenue. In the same way, subsidies to industry may be made either through tax credits that reduce tax receipts or through grants, which do not affect them.
Between the 1990 till 1994 an Incomes policy agreement was established between the government ,trade unions and employers` representatives. Incomes policies are designed to control or guide the growth of incomes of the various groups in society, including wage and salary earners, professional groups, the self-employed and businessmen. These are normally directed at ensuring that none of the above groups abuses any market power it may possess. What is interesting is that this incomes policy effected receipts from income tax. All these factors, once more proves the fact that tax administration regime can change the impression of tax burden. In the international model we used in our comparison, we should not forget that data for some OECD member countries still refer to fiscal years. In the case of Malta we use Calendar years.
To conclude we can say that tax indices should be considered primarily as “indicators of general tendencies rather than of exact tax behaviour” . Strictly speaking from our final analysis we can see that both underground economy and administration of tax regimes can be the culprits of undervaluing tax burden. However as we know the figures we have are only summary of statistics as regards tax indices and do not distinguish between the various types of taxes and government commitments in the various countries. For example the tax ratio in Sweden is one of the highest of the OECD countries. However this has to be seen under the perspective of the commitments to welfare of the Swedish government.
APPENDIX 1