Finally, to get some recent data and stock charts, the news and economic reports on Internet were used. The data of American stock market and British stock market were collected from the website FT.COM and Yahoo.com.
The data and charts were collected before 22nd Dec, 2002. In the next 10 days, the data and charts were organized and analyzed. Because the Chinese stock market was set up in 1990, most data collected were information after 1990. Although, there are about ten different stock indexes, Shanghai Composite Index is the most famous and typical in China, so it was chosen for discuss in this report.
It was easy to get these base data of Chinese stock market from the website STOCK STAR. But some data of Chinese economy were not easy to be collected, since there are some different criteria about the economy of China. GDP was chosen finally, because it is used often and easy to understand.
After relative data were collected, Chinese economy, Chinese stock market and some western stock markets were compared. The purpose of this comparison was to find out the relationship between Chinese stock market and Chinese economy, as well as Chinese stock market and western stock markets.
Findings/Results:
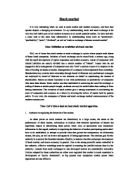
According to the data and charts searched, the stock market of China has been viewed a quick development. In 1990, the stock index was 100 points; in 2001 the stock index was 2245 points, which raised 2245 per cent.
During year 1990 and 2002, some sudden events happened in China, for example Mr. Deng Xiaoping, the leader of China, died, HONG KONG came back to China, Asian financial crisis, Chinese embassy in Yugoslavia was attacked, China was accepted to join in WTO, and China succeeded on its application to hold Olympic Game in 2008. All of these sudden events did make the stock market shake temporarily.
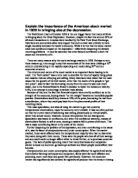
According the data of Chinese economy, from 1990 to 2000, GDP grew strongly.
Refer to chart II, it shows that Chinese economy grew steadily in the lasted ten years. It continued to grow at a rate around 7%, which was higher than that of most other countries.
The chart of USA and UK stock exchange shows that the Dow John Industry index and FTSE 100 Index all dived about 40 per cent from 2000 to 2003. And at the same time, the index of Chinese stock market fell down from 2245 to 1339 points, which is 40.3 per cent. In fact, the change of USA NASDAQ Index ever lead to the rising and falling of some Chinese stocks, especially those related to internet and science 1999.
Discussion
According to the surveys and studies, the Chinese stock index was viewed to rise 2245 per cent from 1990 to 2001. In the same time, the GDP of China grew by around 7% every year.
In 1997, lots of countries of east-south Asia were seriously suffered for Asian financial crisis, and their economies were destroyed. As a result of this, these countries’ stock markets slumped. At that time, Chinese government tried to get credit from its people by holding the RMB stable. It used fiscal treasure to support economic growth steadily. For this reason, the Chinese stock market was still rising during that period. Obviously, the Chinese stock index rising would not realized without economy development. Good economic environment supports the stock market to grow.
When the stock index of USA, UK and China were contrasted, it is obvious that all of this stock indexes fall down about 40 per cent from 2001, which proved that the stock market of China has been affected by the world economy and world stock market.
After comparing and contrasting the Chinese stock market, Chinese economy and western stock market. Conclusion can be drawn that the stock market of China is not controlled by the government, while it runs on itself discipline. And moreover, it is closely related with the world stock market. Another important point is that the Chinese stock market is developing more and more consummate, formal and mature.
Evaluation and Conclusion:
From the findings above, some aspects that affected Chinese stock market have been point out. But are these findings true, impersonal and all-sided?
Actually, this search report always attempted to choose relevant and useful data. First, various dada were addressed. Some reference books were about how to buy stock, some were about European stock markets, and some published about ten years ago. After reading the abstract, four reference books were chosen which were thought more relevant and useful than others. They provide information about relationship between Chinese stock market and Chinese economy.
Some data and charts were collected from Internet; which were also very from each other. It is important to make the data true and authoritative. For this reason, some little or private websites were not chosen, and most data come from the big, famous, and governmental websites such as yahoo.com, FT.com and Stockstar.com.
On the other hand, there are about ten different stock indexes in Chinese stock market, why the Shanghai composite index was chosen? There are lots of different indexes of Chinese economy, why GDP was chosen? The western stock markets were not only USA and UK, why they were chosen? It is clear that they are all very typical and famous so that help to demonstrate things more clearly and trustfully.
References:
Grundy, BD & Kim, Y (2002), Stock market volatility in a heterogeneous information economy, Journal of Financial and Quantitative Analysis, Washington: Univ Washington Sch Business& Administration
Kopcke, RW (2002), Has the Stock Market Become Too Narrow, New England Economic Review. Boston:
Samuel, C. (2002) Stock market and investment: the signalling role of the market, Applied Economics. Washington: Routledge, Hants
Vander, P. F.(1996) Budgetary policies, foreign indebtedness, the stock market, and economic growth, Oxford Economic Paper-New Series. Oxford: Oxford Univ Press