- To gather evidence of scenic interest.
- To undertake one or more visitor surveys and consider effects of different uses.
- To investigate the impact of visitors by looking at footpath erosion.
- To undertake a survey of visitor facilities in the area.
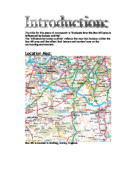
The data used was collected at Box Hill on Tuesday 16th April 2002. The individual methods used were an Environmental Impact Survey, a Tax Disc Survey, an infiltration experiment and Plant Species Transects.
In different areas of Box Hill, an Environmental Impact survey was taken and marks were allocated for the amount of litter, Dog fouling, noise, air quality, vandalism and the amount of space. The areas the survey was taken at were Broadwood’s Folly, Saloman’s Memorial Viewpoint, The Servery and Burford Spur. This is testing the hypothesis because it helps describe the human impact on Box Hill.
To test the hypothesis, a tax disc survey was taken to see whether Box Hill was popular. This tests the hypothesis because if all the cars came from around Box Hill then it would not be a popular destination but if cars came from all over England then this would show that Box Hill was popular. The tax disc survey was taken in the car park near the servery at Box Hill. It was taken by tallying where each car came from. The reason why it was taken at that car park was because that was the only car park at Box Hill.
The Box Hill questionnaire was taken around the servery at Box Hill. It was taken there because that is where the most people were. It was taken by asking people several questions. These questions had restricted answers. This tests the hypothesis because it helps investigate whether Box Hill is popular and why people go to Box Hill.
The plant species transects was taken at the Burford Spur. They were taken there because of the amount of visitors there which helps test the human impact at Box Hill. Also the Burford Spur had many rare plant species. The plant species transects was carried out by stretching out a tape measure 10 metres. Then, every metre the amount of different species was counted using a quadrat. Also, soil depth was measured using a soil pin. The amount of plant species was recorded by how many squares in the quadrat there was of particular plant specie. Altogether there were 25 squares in the quadrat. The common species that were looked for were Fine leaf grass, Tor grass and bare ground. Apart from counting the amount of species every metre, the maximum plant height was also taken every metre.