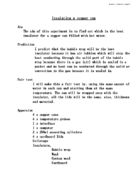
Equipment
Apparatus I will be using in this experiment are:
- A glass beaker
- Cardboard covering
- Stopwatch
- Elastic band
- Kettle
- Water
- Cotton wool
- Black paper
- Foil
- Bubble wrap
- Polystyrene
- Temperature probe connected to a data logger-I have decided to use this rather than a thermometer to get accurate results.
Science theory (1)
I predict that the cotton wool is the best insulator. My reasons for believing this is that the cotton wool has lots of space to trap air. This means that the heat will transfer energy slowly.
Range
The variable I will be changing in the experiment is the material I use. By keeping everything else the same I will be able to determine which material is the best at insulating heat.
Results
Main conclusion
By carrying out this experiment I have discovered that cotton wool was the most effective insulator therefore keeping most heat in. Black paper was found to be the least effective insulator this means that it allowed more heat to escape.
Pattern
From my results I can see that there is a pattern. The pattern is heat from each material decreases and it does not increase. Also there are no anonymous results.
Science theory (2)
I have found that cotton wool is the best insulator out of all the materials. This is because when we heated the water in the kettle it transferred thermal energy to the water particles. As the water particles gained energy they moved around more colliding with each other. The more they moved around the hotter the water got but some of the energy was lost through conduction which made the water cooler. Conduction is when the beaker picks up the kinetic energy from the water it get hot and heat starts to leave the beaker into the surroundings. As we covered the outside of the beaker with cotton wool it helped insulate the water. It did this because the cotton wool traps the air to avoid warm air escaping taking the energy with it.
Method (2)
I found my method was good because it was straight forward and easy to follow. The equipment I used was easy to use apart from the data logger. It kept on switching off half way through the experiment. Then we started the experiment again but this time we changed the data logger but it still turned itself off. It was when I asked the science technician to help me use the data logger that it started to work. I also found that because we started at 70°C we had to wait for the temperature to go down which was boring and time consuming.
Results (2)
I believe that my results to be accurate because when they were compared with other people’s results they were very similar. Also we used a temperature probe and a data logger to get more of an accurate result.
Improvements
I think that certain factors of my experiment can be improved on. The time of the experiment could be increased to 20 minutes rather than 10. The beaker I used could have been better insulated for example the bottom of the beaker could have been covered in material as well. I could have practiced how to use a data logger before the experiment to save time. Also the windows in the room I was doing the experiment in could have been open which may have affected the results.
Quality of results
I believe that the quality of my results were that of a high standard. This I because there was no anonymous results and my results followed a pattern. Also care and precision was taken while collecting the results to ensure a fair test.