A spectrophotometric analysis was taken of each of the seven total samples.
Polysiphonia sp. was not used in the spectrophotometric analysis because it did not seem to work as well as the Porphyra sp. when we were extracting the pigments.
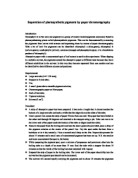
Results
The attached graphs show the spectropotometric analysis of each sample taken. These graphs have the peaks labeled with their corresponding photosynthetic pigments. Below is a list of the species, and the wavelength peaks they had.
Discussion
Chlorphyll a is a pigment that is present in almost all photosynthetic plants. When chlorophyll a is present, peaks should appear on a spectophotometric reading at 430nm and 663nm. Therefore all the species used below should have peaks at approximately 430nm and 663nm. This should only be the case when using a lipophilic extracting agent such as 90% acetone or DMSO because the chlorophyll a is hydrophobic itself.
Porphyra needed to be crushed using both water and acetone because there are pigments in Porphyra which are hydrophobic, and hydrophilic. Therefore the water would remove the hydrophilic pigments, and the 90% acetone would extract the hydrophobic pigments. When looking at the wavelengths present in the spectrometer reading (see graph 1) we see that the hydrophilic pigments of Phycoerythrin (565, 500nm) and Phycocyanin (620 nm) are present. There was also a peak at 436nm which is most likely a little chlorophyll a that was extracted as well.
A seen on graph 2, Porphyra in 90% acetone extracted chlorophyll a with peaks at 434nm and 664nm. However, we did not see peaks that represent the presence of chlorophyll d which is present in red algae. This may be that our samples were contaminated. There were some other accessory pigments present in the Porphyra in acetone mixture. These peaks at 462nm could be some type of carotinoid which is another hydrophobic pigments present in red algae.
Enteromorpha linza was the green algae we tested. Enteromorpha linza should have peaks showing where chlorophyll a and chlorophyll b appear. Both of these pigments are hydrophobic, therefore only 90% acetone was used during extraction. As seen in graph 3, the peaks are marked with the corresponding pigments. Chlorophyll a appears at 434nm and 664nm. And Chlorophyll b shows up at 458nm and 656nm. This last reading for chlorophyll b is slightly off, but this may be a simple spectrometer shift or slight contamination of the solution.
Fucus gardneri was first placed in DMSO which is good for extracting pigments which can be slightly hydrophobic, and slightly hydrophilic. Accessory pigments such as xyanthophyls fall in this category, and have peaks at 450nm. Graph 4 shows Fucus gardneri having an accessory pigment at exactly 450nm.
The pigments in Fucus gardneri were also extracted using acetone in order to remove the more hydrophobic pigments such as chlorophyll a (434nm and 664nm) and chlorophyll c (466nm, 584nm, 620nm). The peaks that represent these two pigments are labeled on graph 5. Two of the peaks for chlorophyll c are quite slight, but could still be valid readings.
When we tested our hypothesis species was Coleus sp. it was postulated that it would have the same accessory pigments as the red algae because Coleus was also red in color. However the results we got from the spectrometer readings were quite different. When pigments were extracted from Coleus using water (see graph 6) a trace of chlorophyll a was found at 436nm and a bunch of other peaks appeared that did not show up in Porphyra in water (see graph 1). The peaks present in Coleus in water may be other accessory pigments that have different wavelength than what we have covered.
The Coleus in acetone did show peaks at chlorophyll a (434nm and 664nm) as well as a peak at 462nm which is most likely a carotinoid pigment of some type.
In conclusion, the test plant, Coleus sp. did not appear to have the same accessory pigments as our red algae species of Porphyra sp. Even though the plants appeared to be the same color externally, their photosynthetic pigments are not the same.