Having taken all this information into account, my plan will be as follows:
- Use a water plant to control two things- firstly that the oxygen produced can be collected and measured and secondly so that water will be measurable and in excess to ensure that it does not limit the rate of photosynthesis.
- Measure the oxygen produced by simply counting the bubbles released by the plant.
- Use Sodium Hydrogen Carbonate, which dissociates in water to release carbon dioxide, ensuring that this is not a limiting factor. However, this dissociation also produces sodium hydroxide which is alkaline so I will need to use a buffer in order to maintain a constant pH.
- Control temperature by constantly checking it with a thermometer and stopping the experiment to either warm the water or cool it if the temperature changes.
- Always use the same plant, in order to control the amount of chlorophyll available for photosynthesis .
- Always use the same volume of water. Although, theoretically, water should be in excess, it is a possible source of variation, so should be controlled.
- Use the same source of light at all times. Chlorophyll absorbs light at the red and violet ends of the spectrum, reflecting green and yellow away from the plant. Different light sources could contain different wavelengths of light.
Method
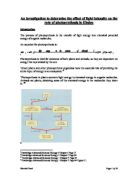
- Take a piece of Elodea (Canadian pond-weed) and immerse it in a beaker containing 500ml of water, mixed with Sodium Hydrogen Carbonate and a pH buffer.
- Place a funnel over the elodea to channel the oxygen bubbles.
- Place a test tube filled with water over the end of a funnel to make it easier to count the bubbles produced.
- Start with the light source at 1m distance and allow the elodea 2 minutes to acclimatise before taking any measurements. Starting at this distance reduces the heating effect of the lamp on water.
- Count the bubbles of oxygen produced over a 2 minute time period and record.
- Repeat twice at this distance. Discard any obviously wrong readings and repeat them to ensure reliability.
- Repeat steps 5 and 6 with the light source at 80cm, 60cm, 40cm, 20cm, and 0cm, not forgetting to acclimatise the elodea for 2 minutes each time the light source is moved and to check the temperature of the water regularly.
List of apparatus
Elodea
500ml beaker
Funnel
Thermometer
Test tube
Stop Clock
Sodium Hydrogen Carbonate
Lamp (light source)
Metre ruler
Preliminary work
Since temperature and carbon dioxide levels will affect the rate of photosynthesis, I have done some preliminary work to determine which levels are optimum for the particular plant that I am using. The results are shown below.
Tables shown here
My preliminary work has enabled me to determine the optimum levels of temperature and sodium hydrogen carbonate (i.e. carbon dioxide). From the table, I can see that the temperature should be controlled at 20ºC - the optimum temperature for enzymes in this particular plant. After this temperature the enzymes begin to be denatured. Also, I will add 2.5% sodium hydrogen carbonate to the water. After this level extra sodium hydrogen carbonate will have no effect on the rate of photosynthesis because carbon dioxide is no longer a limiting factor. Adding more might adversely affect the pH balance of the water.
Prediction
My background research has led me to make the following prediction:
Increasing the light intensity will increase the rate of photosynthesis, assuming that all other factors are not limiting. This is because a higher light intensity provides more energy for the reaction to go ahead. Furthermore, I predict that doubling the light intensity will double the rate of photosynthesis, because the molecules will have twice as much energy and therefore will collide with twice as much force and hence the reaction will proceed at twice the rate. In photosynthesis, the energy is used to excite electrons within the chlorophyll molecule and raise them to higher energy level. The energy which they release as they fall back to there original energy level is harnessed and used to combine carbon dioxide and water. Double the light energy would mean double the number of electrons excited.
Finally, I predict that my graph will level off towards the end, as chlorophyll begins to work at its maximum rate, and increasing light intensity will have no further effect on the rate of photosynthesis.
Results
Graph
Conclusion
As my graph and table of results show, increasing the light intensity does indeed increase the rate of photosynthesis, as I predicted. In order to demonstrate the proportional nature of this relationship, a little maths is necessary:
At 10% light intensity the volume of oxygen produced was 0.08cm3. Using this as a baseline, I would predict the results to be as follows-
Allowing for the error inherent in rounding up or down two decimal places, the results show that the relationship is proportional, again backing up my prediction.
The final part of prediction was that the graph would level off towards the end, as the plant, as the plant began to photosynthesis to its maximum rate. This did not happen, for two possible reasons; firstly the measurement '100%' does not mean all of the available light in the world. It is a relative term describing the light intensity within the experiment. Therefore, it would be possible to continue increasing the light intensity still further, at which point we would probably see the rate of photosynthesis level off. Secondly as mentioned previously, chlorophyll absorbs light at the red and violet ends of the spectrum, reflecting green and yellow away from the plant. It is possible that the light used contained less red and blue light than the plant needed, and it was therefore unable to photosynthesise at a maximum rate.
Overall, the results have supported my prediction well. If a plant is given access to excess carbon dioxide and water at optimum temperature and pH levels, light becomes a limiting factor and therefore the higher the light intensity, the higher the rate of photosynthesis. The light provides the energy needed to excite the electrons and begin the electron transfer chain in the light dependant stage of photosynthesis.
Evaluation
The experiment was not carried out according to my plan. Due to inaccuracies involved in controlling the variables in the lab, and counting the bubbles of oxygen produced, I used a computer simulation to ensure that the results I obtained were accurate and reliable. Because the computer is programmed to control other factors, it can ensure complete reliability so every time the experiment is repeated, it gives exactly the same results. This has lead to my results being extremely reliable(every repeat at the same light intensity has given identical results) and also accurate (all of the points fit well on the line of best fit and there are no anomalies).
One major difference between my plan and the computer simulation was the introduction of a gas syringe. This makes the results much more accurate, because counting bubbles of oxygen is extremely unreliable. Each bubble would be of a slightly different size and it would be easy to miss some of the smaller bubbles. A gas syringe gives a measurement of the volume of oxygen produced which is much more accurate. This would be possible in a laboratory, so if I were to plan this investigation again, I would ensure that a gas syringe was used.
In a laboratory situation, light intensity would be much more difficult to control. For example, light from other students' investigations might also be shining onto my beaker, affecting the light intensity. I could have controlled this by using black paper around the beaker, thereby ensuring that the light was directed and only light from my lamp was reaching my pond-weed. However, this would effectively block half the chlorophyll from absorbing any light energy. Another way of doing this would be to use a light probe and data logging equipment to more accurately measure the light intensity in Lux, rather than relying on the inaccurate measuring of the distance from the lamp.
Also as I have previously discussed, the heat given off by the lamp could have affected the results by varying the temperature that the plant was exposed to. I could have prevented this by using a sheet of glass Perspex that was thin enough to allow the light to pass through unhindered, but would still absorb much of the heat energy.
For further work, I would like to pick up on one or two of the factors which I have already mentioned. Firstly, I have found out that chlorophyll absorbs light at different wavelengths. I could investigate the effect of different wavelengths on photosynthesis. This might give me an indication as to whether or not the wavelength of the light was the cause of my graph not levelling off. I would expect, if I used a red light source, the graph would level off fairly quickly because all of the light would be being absorbed and used effectively.
In conclusion, I believe that the results I have gained in this investigation are extremely reliable due to the use of a computer simulation. As discussed, in the lab, my method has many sources of error, but if I were to repeat this investigation I would make the changes suggested above to try to eliminate the possible sources of error as far as possible.