An experiment to show the progress of osmosis in potato tissues.
An experiment to show the progress of osmosis
in potato tissues.
Aim
The aim of this coursework is to investigate the rate of osmosis in different concentrations of sugar solution using potato tissues.
Prediction
I think that in sugar solutions of high concentration, the mass of the potato will go down. This is due to the rules of Osmosis.
Osmosis is the movement of water molecules across a partially permeable membrane, from a region of high water concentration to a region of low water concentration.
There are two types of diffusion. These are:
* Partially permeable membrane. This allows SOME particles to diffuse through things and not others. Most cell membranes are permeable to water. Diffusion of water through a partially permeable is 'The direction and rate of osmosis which depends on the differences in water concentration between the two sides of the membrane until equilibrium'.
Only water molecules are small enough 2 diffuse through a partially permeable membrane.
The tendency for water to move through a partially permeable membrane is described as its water potential and is at a maximum in pure water, if sugar is added to the solution, it lowers the water potential. The water potential depends on how much sugar solution is added. In high concentrations of water, the amount of sugar is low and in low concentrations of water, the amount of sugar is high.
As the two solutions are divided by a semi-permeable membrane, the water will move from a high concentration to an area of a low concentration, until both have reached equilibrium (this is where both solutions are equal). This happens due to the rules of osmosis. When both concentrations are equal, this is called isotonic. At this point, there is no change in length, volume or mass of potato because the net movement of the particles will be zero, therefore, no osmosis occurs. This movement must take place across a partially permeable membrane such as a cell wall, which lets smaller molecules such as water go through but does not allow bigger molecules (sucrose in this case) to pass through.
So as I will be placing the potato tube into pure water, water will move across the semi- permeable membrane into the cell by osmosis making the potato swell, in other words, turgid. This means the potato will increase in volume and mass because of the extra water content. If the potato tube is placed in a low water concentration, the opposite will happen and the potato will decrease in mass and volume. This makes the potato become flaccid. This means the contents of the potato cell shrinks and pulls away from the cell wall. These cells are said to be plasmolysed.
Diagram
Planning
Key variables
I will be keeping the mass, volume and length of the potatoes the same throughout the experiment, I will also be doing the experiment at room temperature. There are variables (mass of potato tubes) and non variables (duration). If any of the non variables are not kept at a constant it would mean my experiment was not a fair test. E.g. if one of my potato tubes were 1cm longer than another, then the results of this would be inaccurate because for that potato tube there would have been more surface area for osmosis to occur on than the tubes with a smaller surface area.
The variable which I will change is the concentration of the sugar solution. The rest of the variables will be kept at a constant. I have chosen to change the sugar solution because I think this will be a good experiment to prove if osmosis is affected by the concentration of a solution. This will give me a varied set of results which will give me a good conclusion.
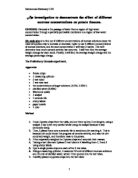
The key variables that we can change in our experiment is:
* Size of potato: We can measure the size of potato and measure if different sizes effect how much the mass is changed during the progress of osmosis.
* Concentration of sugar solution: We will be using 1 molar of sugar solution; we will dilute it until it is pure water solution.
* Temperature: We could change the temperatures of the sugar solution and see if it makes the rate of osmosis quicker of slower and see if it affects the amount of mass lost or gained from the potato tubes.
* Time: We can work out how much mass in the potato is gained or lost in 1 hour, 2 hour, 3 hours etc and see if osmosis stays at the same rate throughout the experiment or if it increases/decreases as time goes on.
* Shape: we can cut out different shapes of potato and see if ...
This is a preview of the whole essay
* Temperature: We could change the temperatures of the sugar solution and see if it makes the rate of osmosis quicker of slower and see if it affects the amount of mass lost or gained from the potato tubes.
* Time: We can work out how much mass in the potato is gained or lost in 1 hour, 2 hour, 3 hours etc and see if osmosis stays at the same rate throughout the experiment or if it increases/decreases as time goes on.
* Shape: we can cut out different shapes of potato and see if the rate of osmosis is affected by different surface areas.
Variables
Non-Variables
Solution concentration
Surface area
Solution volume
Duration of experiment
Temperature
Solution
Weighing scales
Conditions (all potato tissues must be treated the same)
My fixed variable will be all the non- variables shown above and my variable which I will be changing will be the solution concentration.
How will I ensure it is fair tested?
For the experiment to be accurate, we must ensure that the experiment is fair because if it is not a fair test, we will be obtaining the wrong results, Which would lead to wrong conclusions and so on.
First of all, I will keep these the same throughout the experiment:
* The mass of potato: this is because if I make some large and some small, this will make my results unreliable because in smaller pieces osmosis may be quicker or slower than in big pieces.
* Temperature: because if I do some of the experiment in hot water and some in cold water, it may effect the outcome of the results because reactions usually react faster in warmer conditions.
* Shape/size: because different surface areas may lead to different results.
We will get the measurements and weights of the solutions and potato tubes as accurate as possible, evenly cutting the potatoes and recording the mass and length of each potato tube to the nearest millimetre. We will be using a chemical balance so the masses of the potatoes will be recorded down accurately. Also before and after the experiment, I will first dry off the excess water around the potato, then weigh it because if the water surrounding the potato is not removed, it will affect the weight of the potato.
To make sure it is totally fair, I will make sure the potato tubes are fully covered in the solution; this is because if the potato was not fully covered, parts of the potato which were not covered will not partake in osmosis.
I will also make sure the measurements of molar and water in the test tubes are vital because if in one test tube the solution was higher/lower than it should be, it would affect the outcome of the results.
I will be carrying the experiment in room temperature for 3 hours, to avoid temperature change (which could affect out different sets of results), we will take the temperature of the solution into account. Another factor we must take into account is to start and stop the clock as quickly as possible. This means I will have to start the clock as soon as the potatoes are put into the test tube and to stop the clock as soon as they are taken out of the tube. To measure all the sets of results in less than a minute is quite impossible because there is little balances shared between the class, Therefore I will try my best to weigh the potatoes as quickly as possible and accurately as we can.
How to make the solutions with 100ml.
Molar?
How much water (ml)
How much sugar solution. (ml)
m
0
00
0.8m
20
80
0.6m
40
60
0.4m
60
40
0.2m
80
20
0m
00
0
Small things such as a dirty test tube etc will be taken into account as well, all equipment will be washed thoroughly before use.
How will I ensure it is safe
Although the experiment seems very harmless as the experiment is basically putting potato tubes into a test tube of sugar solutions, safety is an important aspect in every experiment so it must be taken into account.
As we will be using a sharp knife to cut the potato, we will use a core borer instead to decrease the risks of an injury. Also we must be careful with the solutions, we must not drink the solutions because we do not know if any damage would be done to our bodies if we do drink it. The measurements for the solutions have to be accurate so it does not change the outcome of the experiment.
Other than that, there are no other dangerous hazards which could happen.
How to ensure the experiment is reliable and precise.
We will repeat the experiment three times so that we can make sure that all our results are similar, and so we will be able to take the average of the 3 experiments. This makes sure that we get accurate results. Repeating the experiment is important, because we will be able to collect valid results, and look for any anomalous results. (results which are wrong) Also we will take fair testing into account.
Preliminary work
Potato
Solution (molars)
Weight before (g)
Weight after (g)
0m
3.32
3.44
2
0.5m
3.3
2.22
3
m
3.39
2.10
The length of the potatoes where 5cm long and 0.9cm wide
Duration: 3 hours.
These preliminary results give me an overall impression on the change in mass, gain or loss when placed in varying concentrations of sugar solution.
In my preliminary work, it shows when it is just water, the mass of the potato increases and when the potato is in a 1m sugar solution, it decreases in mass. This is because the water molecules in the potato wants to reach equilibrium making the to concentrations equal so water molecules leave the potato tube when the solution is 1m, therefore making the potato decrease in mass.
Looking at the results of my preliminary work, I do not think there is enough results so I have decided to use the rang of 0m-1m of sugar solution, I will go up in 0.2m and I will repeat the experiment 3 times.
Method.
* Set up the apparatus as shown in the diagram.
* Cut potato pieces (all the same) by pushing the core borer through the potato, cutting it into long cylinders with a diameter of 9mm.
* Remove excess water from potatoes and measure the mass.
* Weigh 6 sets of 3 potato cylinders. (I will have 6 sets of potatoes because I have 6 different solutions to test out.)
* Make the sugar solution e.g. 1m, 0.8m etc and place them in test tubes.
* Add potato tubes into each test tube.
* Start stop clock
* Leave for approximately 3 hours; take potato tubes out of test tube.
* Dry of excess water.
* Measure the decrease/increase in mass of each set of potato tubes and record it down, also measure the average reading of the 3 pieces.
* Repeat 3 times.
Equipment.
* Potatoes (to experiment with)
* Core borer (to get pieces of potato)
* Ruler (to measure the length/width of the potato)
* Cutting tile (to cut the potato)
* Scalpel (to cut the skin of the potato)
* Sugar solution (1m)
* Chemical balance (to measure the mass of the potatoes)
* Stop watch (to time how long the potato tissues were in the test tube)
* Paper towels (to dry off excess water on potatoes)
* Knife (to cut the potato)
* Measuring cylinder (to measure the solution)
* Water (to dilute the sugar solution)
Results
A table to show the results of 3 experiments in 6 different sugar solutions
Concentration (m)
Total mass of 3 potato tubes at start (g).
Average mass of the 1 potato. (g)
Mass of potatoes after 2 hours (g)
Average mass of 1 potato after (g)
Change in mass with 3 potatoes (g)
change of mass in 1 potato (g)
% change in mass
% change in 1 potato tube.
0
8.18
2.73
8.82
2.94
0.64 increase
0.21 increase
7.82 Increase
7.69 Increase
0.2
7.80
2.6
8.15
2.717
0.35 increase
0.117 increase
4.48 Increase
4.5 Increase
0.4
8.05
2.68
6.95
2.317
.1 decrease
0.363 decrease
3.66 Decrease
3.54 Decrease
0.6
8.21
2.74
5.87
.957
2.34 decrease
0.783 decrease
28.5 Decrease
28.5 Decrease
0.8
8.10
2.7
5.82
.94
2.28 decrease
0.76 decrease
28.14 Decrease
28.14 Decrease
8.81
2.94
6.05
2.017
2.76 decrease
0.923 decrease
31.32 Decrease
31.39 Decrease
In the table above, the percentage shows a steady decrease which tells us that the percentage decreases as the concentration becomes stronger.
To find the percentage increase/decrease I took the mass which was increased or decreased--> Divided by the original weight and multiplied by 100.
This shows that in solutions of pure water and 0.2m sugar solution, the mass of the potato tubes increase and solutions 0.2m plus make the potato tubes decrease in mass.
This proves my prediction true, that in high concentrations of sugar solution, the mass will go down. After the experiment, I dried the potatoes first, so that the water outside the potato would not alter the weight of the potatoes. When obtaining my results, I reset the balance so it would read zero, then every time I weighed another set of potatoes I would wipe the balance in case any water was left and I would wipe of excess water of the potatoes as well.
The 0.6m solution should make a difference now because the two concentration gradients are different. Therefore, the weight should change, at least noticeable for us to notice.
The difference in water concentration in the potato and 0.8m solution of sugar solution is big, so the water in the potato should be transferred from the potato, through the permeable membrane, to the solution surrounding the potato tube.
And as a result, I am sure that the weight of the potato will decrease largely. Also, as the potato tubes are surrounded by a strong solution, the potato will become smaller and will shrink.
The graph of 'change in mass compared to concentration of solution' shows that when the solution is weak the mass of the potato increases and as the solution becomes stronger, the mass decreases. You can tell this because the points go from a positive to a negative. Also it shows that the equilibrium point of the potato and the solution would be between 0.2 and 0.4 because that is the point where the mass of the potato changes from a increase in mass, to a decrease in mass. It also shows an anomalous result in the graph, although it is not too obvious that it doesn't follow the pattern, if I did the experiment again, I would repeat the concentration (0.6) to correct the result.
The graph of % change compared to concentration of solution' shows that as the solution gets stronger, the percentage change decreases. You can tell this as the points go from a positive to a negative point. This also shows there is a slightly anomalous point (0.6) because the percentage change seems to be more than the results of the 0.8m solution. To make the experiment more accurate, I would redo this concentration and see if it is any different.
This graph shows that at the start when the concentration of the solution wasn't as strong the mass increased in the potato tube but as the solution became stronger (0.4m+) the weight began to decrease. This also shows a negative correlation where the points are close to the line of best fit.
This graph shows that the weaker the solution, the mass of the potato increases, but if the solution is stronger than 0.4m the mass of the potato tissue decreases. This graph is similar to the first graph because this is the average of the results above. It also shows negative correlation where the points are quite close to the line of best fit.
On the graphs shown above, I have made the 'different molar' solutions as my independent variable, the rest of the variables are kept the same.
Conclusion
In this experiment, I think I have collected enough data to support my prediction. This investigation was quite successful because I don't think I got any anomalous results. My prediction was proven right. The Potato cells took in or gave out water molecules depending on the concentration of the tissue and the concentration of the solution it was surrounded in. The results are fine and by looking at the experiment, you can see that the masses of the potato tissues are quite accurate. (7.80g-8.81g), Although it was only 1g difference, the percentage change in the potato tissues tell us more accurate results than the change in mass.
The graphs and results show that:
* Osmosis actually took place in the experiment.
* As the solution became stronger, the percentage of weight difference decreased.
Evaluation
I gained a good set of results and altogether I am pleased with my investigation. The graph obtained from the results follows the guide of my prediction. This suggests that the experiment was quite accurate.
I think 3 repetitions of each concentration would be sufficient, so I put 3 potato tubes in each test tube filled with different molar solutions. I did this to save time and ..............The only mistake which could have happened was that 0.6 and 0.8 molar results are very close (circled on graph). This part of the investigation would need to be repeated. A possible factor which affected my results is although the potato tubes were cut to the same size, there is no guarantee that the densities of the tubes are the same. Further work could be carried out to include concentrations that increased in 0.1m rather than 0.2m. This would have increased the accuracy and improve the graphs. Another investigation would be to find out how much molar sugar solution would make both the solution and potato tissue to reach equilibrium. On my graph of 'change in mass compared to the concentration' it shows that equilibrium would be between 0.4 to 0.6m. I would have used more varied concentrations e.g. 0.45m, 0.5m, 0.55m etc.
We followed the plan correctly; I think we gained accurate and sufficient results to conclude the experiment. I think my final results were reliable, because of the precautions I took to make this a fair experiment.
To improve the experiment, I would repeat the experiment again, and I would put the potato tissues in each solution 2 minutes after each other so when taking the potato tissues out and weighing them, they can be dried, weighed and recorded what the results were, then wait till the 2 minutes are up and moving onto the next set of results. The reason for this is because it would be more accurate to put it in 2 minutes different each so we can concentrate on one set of results each time. Another alternative would be to have more people to do the experiment. An advantage of this would be so we can organise the tasks and let each person have a specified job to do.
Experimenting with one set for a longer period of time, would lead to better results because the rate of osmosis would reach its maximum capability, and therefore tell us how much water could be transferred for each solution. If I was to repeat the experiment I would increase the time of the results to allow more osmosis to happen and even find the saturation point of the potato tissue. I thought the cutting of the potato was the most important part and most risky part of the experiment because although the potato tissues were cut to the same size, the density and weight of the tissue was varied. As well as the potato, I could have found a more accurate way to measure out the concentrations of the solution. I could have used a burette. This would ensure I had the right amount of liquid in each test tube. I could also weigh each chip on a more accurate scale, e.g. not to 0.00g but to 0.0000g.
Looking at the line of best fit on my graphs, there are not any anomalous results, but some were not as close to the line as others. This may have been caused by human. When the potato chips were removed from the test tubes and dried I may have dried some potato tissues more thoroughly than others, so some could have more excess water, which would add to the mass, therefore leading to inaccurate results. If the experiment was repeated I could find another way to dry the potatoes that would ensure that all were dried in the same way for the same time.
However, overall I think the experiment was successful and I was pleased with the results I obtained.