Variables
- In order to make my experiment fair, I must keep some factors constant: -
- Volume of hydrogen peroxide (Independent variable)
- Surface area of yeast
- Temperature of hydrogen peroxide
- Temperature of room
- Concentration of hydrogen peroxide (Dependant variable)
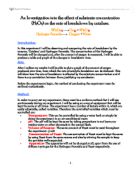
Substrate concentration
A higher substrate concentration means there is a greater number of substrate molecules. Therefore, there is a higher probability that the molecules will collide and so the reaction will occur at a faster rate. Although, if the enzyme is kept constant, there is a point where increasing the substrate concentration will not increase the rate of reaction as all the active sites will be in use.
Enzyme concentration
There are more molecules present with a higher enzyme concentration. When there is a high enzyme concentration, there are more active sites available for substrate to use. This means there is a higher chance and more opportunities for a substrate colliding into an available active site. The more collisions with the active site, the faster the reaction.
Surface Area
The larger the surface area, the more enzyme molecules are exposed and able to react and a greater possibility of collision. Therefore the larger the surface area, the faster the reaction rate. To keep this constant I will dissolve my yeast so that it has the maximum surface area and also the same surface area each time.
PH Level
The Ph level of a fluid surrounding an enzyme can change the shape of the active site by interfering with the positive and negative bonds that hold the protein together. And as I have said when an enzyme becomes denatured it no longer works as a catalyst. All enzymes have an optimum PH level this is often 7 this is the case with Catalase.
Temperature
At a high temperature there is a lot more energy so the molecules vibrate and move faster and more freely, the molecules have more opportunities to collide and react.
This means collisions occur more often. However if the temperature is increased too much the collision becomes too energetic and the bonds between the active site begin to break. Catalase’s optimum temperature is 37oC. This means the enzyme works most effectively at this temperature. To keep this variable fair I will do all of my experiments at room temperature and will try to do as many of the tests as possible each lesson to avoid the change in room temperature between lessons.
Method
Equipment;
• 5 x test tubes
• Test tube rack
• Pen (to mark the test tubes so you don’t get them confused)
• 2 measuring cylinders (one to measure the hydrogen peroxide and water, and one to measure the amount of oxygen collected)
• Bowl/ ice cream tub
• A scale
• 2 beakers
• Pipettes
• Yeast
• Stopper with delivery tube (to stop any oxygen from escaping and directing it to the right place)
• Hydrogen Peroxide concentrations- 5%, 10%, 15%, 20%
• Clamp stand (to hold up the cylinder
• Stop watch (to time the experiment)
• Thermometer (to measure the temperature of the room and the hydrogen peroxide with water)
Safety
• Goggles and gloves must be worn when working with hydrogen peroxide as it will burn your skin and eyes.
• Mark the beaker with hydrogen peroxide in it (with a sticker) – incase you touch it without knowing.
• If hydrogen peroxide spills onto your hand, you must wash it under water quickly
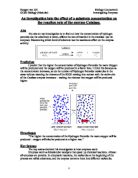
Setting up
- I will find all the equipment shown above and put it together, as shown in the diagram above.
- I will then fill up the ice cream tub full with water from a tap.
- I will then clamp the measuring cylinder next to the bowl.
- I will take the tube and place it in the bowl.
- Next I will fill up the measuring cylinder with water from the tap.
- I will place the measuring cylinder over the tube and clamp it back in place.
- Then I will weigh out some yeast granules.
- I will then fill a test tube with 10ml of water from a tap
- Then I will add the yeast to the water – put the bung (stopper) in- and shake the test tube until the yeast is completely dissolved.
- Then I will add the weakest dilution first.
- I will put the bung with the tube in the test tube.
- Then I will start the stopwatch.
- I will record the amount of oxygen gathered in the measuring cylinder every 10 seconds.
- I will do this for 70 seconds.
I will repeat this 3 times with each concentration.
Preliminary Results
Changes to be made to method
I am going to make a few changes to my method;
Firstly I am going to dissolve the yeast instead of adding it straight into the water this is because the surface area yeast granules will affect the over all result as if the surface area is greater the more area there is for the hydrogen peroxide to come into contact with the enzyme – making a reaction more likely. As the granules in my preliminary where all of a different size it made the test unfair. It would be impractical to search for yeast granules that were all exactly the same size so instead I am going to dissolve them instead.
Secondly I don’t think there is any need to change the; amount of yeast, hydrogen peroxide or water as the foam never reached the top and I was always able to see the difference in hydrogen peroxide levels every 10 seconds.
There was a slight error in each experiment as when the bung was pushed in it would displace some air into the measuring cylinder that was measuring the amount of oxygen produced. This can be seen in my preliminary results as when there was a 0% concentration of hydrogen peroxide there should be no reaction so no oxygen should be produced and the amounts shown on the table are of air that has been displaced. However this is only about 1 ml of oxygen and as it is about the same each time it means this did not affect the fairness of my results.
I think I was fairly good at keeping all the constants constant in my preliminary so I wont have to change anything – except for the surface area as I have already mentioned. However it is also important to use the same tools and stick to my method if I want to achieve a fair set of results.
I also chose to do three repeats as it will help me to distinguish outliers. Ideally I would like to do more as the more I do the more accurate my results will be. However, I have only a set amount of time to do the experiment so I have decided that three repeats was the most I could do in the allocated time.
Final Experiment
Results
Averages
My investigation has shown what I predicted “The higher the concentration of the Hydrogen Peroxide the more oxygen will be produced – oxygen will also be produced at a higher rate.” My experiment also showed me that the reaction didn’t occur at any specific rate but started off fast – when the water was saturated with hydrogen peroxide and Catalase – and slowed down nearer the end of the experiment – when there wasn’t so much hydrogen peroxide left. This also proves my theory that the more hydrogen peroxide and Catalase the more chance of them coming into contact with each other and reacting.
Rate of reaction
This table shows the optimum concentration for producing O2. it shows that from 5% to 15% the rate of reaction raised, however after that it had reached its optimum rate and started to decline again. When making this graph I took the time from when the reaction had stopped happening. The time it took for a reaction to completely finish was also a good pointer to which concentration was optimum.
Error bounds.
This table shows the error bounds between the experiments, however it does not show any trend that suggests that the higher concentrations were more reliable or vice versa, this means that these error bounds can only be put down to human error or other variables. For example in the lower concentrations the measurement was often 3 or 4 ml. When measured, the nearest measurements were taken so if the measurement was in between two ml points - it was rounded. And since the Measurements were so small it may have been these rounding that affected the error bounds of the lower concentrations.
For the higher concentrations the error bound may have occurred as the bung was not put in soon enough after the reaction had started and as the reaction occurred so fast some O2 produced escaped and was not gathered.
Conclusion of Method
The way I chose to carry out this experiment was fairly accurate. I kept the ‘constants’ constant and each experiment was preformed exactly the same (with different concentrations) so that all the results were valid. However, I feel I still could have improved on my method;
I could have weighed the yeast more accurately to make certain they were the same weight, which they should be to make the experiment fair. If I were to do the experiment again, I would make sure I do this, and also to make my results even more accurate, I could have taken note of the volume of oxygen at more regular intervals such as every 5 seconds. This would help me get a more precise set of results and graph and I would be able to see each stage of the reaction more clearly, which would have helped my analysis a bit more. To do this I think I would have had to do it electronically. I would also need to find a new way of measuring the volume of oxygen in the measuring cylinder. I could use a thinner measuring cylinder with more accurate measurements on the side and I could also add ink to the water so it would show up more clearly against the measurements.
Conclusion of Results
The results I got fit the pattern I predicted. There were no outliers in my data table and the largest applicable error bound was 27%, even though this number seems large the results evened themselves out to a 12% error bound within the next 10 second interval. This shows that the reaction “caught up” with other reactions
The reason for all these anomalies is that maybe my method slipped up for reasons I have said previously - which meant some results were very close together and some were very far apart. The only difficulty I encountered when doing my experiments, was starting the stop watch, because I needed to put the stopper into the test tube at the same time, but I got over this problem by asking someone close by me to start it for me.
I could have taken my investigation further, by heating the hydrogen peroxide to 37°C, which is the optimum temperature for enzymes. This would have meant that the enzyme would be at its peak activity rate, so more oxygen would have been produced in the same time, because there would have been more successful collisions.
I could also have measured the room and water temperature. I do not think that it changed to dramatically over the course of my investigation so I thought it would not be the best use of my time.
Bibliography
Wikipedia
Sam learning
CGP revision books.