Fair Test
As I am measuring the rate of Osmosis, I shall keep the other factors the same. I shall be using the same variety of potato so that I can be sure that the semi-permeable membranes will be the same in their genetic makeup. The solution in each beaker shall always be equal to 25ml. All potato chips shall be left in their solution for the same amount of time. I shall use the same equipment throughout the experiment and prepare each potato chip in the same way. I shall do the whole investigation at room temperature so that I can ensure that the experiment won’t be affected by temperature.
The concentrations of sucrose solutions I shall use will be 0.0M, 0.2M, 0.4M, 0.6M, 0.8M and 1.0M. This will give me a very varied set of results from which I hope to make an accurate conclusion. If any of the non-variables were not kept constant it would mean it would not be a fair test. For instance if one of the potato pieces was 1cm3 larger in mass than the others, the surface area of the chip would be larger and would therefore be more space for osmosis to occur.
Safety
When using the core borer and scalpel it is important to keep fingers at a safe distance as the equipment is very sharp and poses a health threat if used incorrectly. Care must be taken whilst walking around the laboratory with beakers, scalpels and core borers.
Prediction
I predict that by increasing the concentrations of the sucrose solution, the mass of the chip will initially increase, and then the changes will gradually decreases until mass is lost, this loss of mass will gradually increase.
The reason for this is that when the sucrose concentration is low, the concentration of water outside the potato cells will be greater than inside and water will diffuse into the potato cells and the potato chip will gain mass. When the sucrose concentration is higher, the concentration of water inside the cells will become less than outside and water molecules will diffuse out of the cells and mass will be lost.
A diagram to show the process of Osmosis.
DILUTE SOLUTION CONCENTRATED SOLUTION
Sucrose Particle Semi-Permeable membrane
Water Molecule Osmosis
Preliminary
I have conducted a preliminary experiment (enclosed within). The results give me an overall impression of the change in mass, gain or loss when placed in varying concentrations of sucrose solution. It has also has shown me that when conducting my final experiment I shall need to be more accurate when pouring amounts of sucrose solution and water. It was inaccurate when I simply measured with a ruler, the size of the potato pieces. I should have used an electric weighing scale to measure the amount of osmosis carried out by the potato piece.
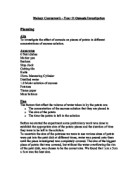
Apparatus
Potato chips, Electronic Balance, Core Borer, Scalpel, Sucrose Solution, Distilled Water, Beakers, Labels, Measuring Cylinder and Paper Towels.
Method
- Take two average sized ground potatoes and check that they are both healthy and hard.
- Using a scalpel, a core borer and an electric weighing machine cut the potato chips into 18 small pieces, with a weight of 2.0mg.
- Take 6 beakers and label them with the appropriate concentration of sucrose solution.
- Using a measuring cylinder measure out different amounts of sucrose solution and distilled water which then should be poured into the test tubes in a percentage ratio giving me the various molar concentrations. The total amount of sucrose concentration should equal 25ml.
- Pour the Sucrose solution into the appropriate beaker.
- Weigh each potato chip again for further accuracy on an electronic balance.
- Swiftly insert a potato chip into each beaker and then record the time.
- After a day drain out the solutions in the sink and place all the chips onto paper towel with the concentration they were placed in written on the paper towel as to not become confused as to which chip came from which solution.
- Place each chip on the electronic balance for them to be weighed.
- Measure each potato chip accurately on the electronic balance and then record the weights to 2 decimal places.
-
Redo the experiment under exactly the same conditions. This shall give a secondary set of results, which offer a higher degree of accuracy.
Table to show how to make up the solutions of Sucrose Solution
Table to show how I am going to be collecting my results
(after conducting the experiment)
Results
First experiment
Repeated experiment
Average
Average Mass increase
Graphs
From my results I have plotted one graph for the mass increase for each time I conducted the experiment as well as the average of the two. I also then plotted a graph for the average percentage change in mass and a line of best fit.
Analysing Evidence-
As you can see from my tables and graphs I collected two sets of results for each concentration of sucrose solution. I then took an average between these two values at each concentration, and I constructed a further table of average mass before, average mass after, and average percentage mass change. I then plotted a graph of average percentage mass change against sucrose concentration.
From the graph, you can see that as sucrose concentration increases, first at 0.0M, the percentage mass change is a large gain of 41.21%. This falls to an increase of 18.5% at a concentration of 0.2M. The mass change is 0.0 at a concentration of 5.7M. The percentage change in mass continues to fall rapidly, and at a concentration of 0.6M the mass decreases by 13.57%. When the concentration is at 0.8M, the decrease becomes slightly less rapid and the percentage mass lost is 26.63%. The decrease further evens out, and at a concentration of 1.0M the mass lost is 65.24% and the line evens out yet more.
The reason for these changes in mass is osmosis and the rate and direction of osmosis is different at varying concentrations. When the concentration of the sucrose is 0.0 the water concentration is higher outside the potato chip. This concentration gradient therefore causes water molecules to pass across the semi-permeable membrane and into the potato chip cells. This occurred at concentrations of 0.0, 0.2, and 0.4, where the mass of the chips increased. This caused the cells of the potato chip to become turgid as they were filled with water.
At a concentration of 0.57M, the concentration of water if water outside the chip and inside were the same. The potato chip and the solution outside it were at a state of equilibrium. The net movement of water was 0.0, and the mass of the chip neither increased nor decreased.
At concentrations of 0.6, 0.8, and 1.0, the mass of the chip decreased. This is because the concentration of water inside the potato chip was greater than the concentration of water outside therefore water passes out of the cell. This caused the cells of the chip to become flaccid as they contained less water.
The trend of my graph is that firstly the mass is gained, and then the mass increase decreases until it becomes a mass decrease. It continues to decrease but levels off slightly at the end. This is as the concentration increases.
My results support the prediction I made in planning.
Evaluating Evidence-
On the whole I think that my procedure was quite reliable and suitable, but there are aspects of my procedure, which I could have improved on.
My method of drying the chips after use could have been changed so that water that showed the effects of osmosis would not be unnecessarily removed from the chips.
If I could have in some way prevented the potato chip from floating, all of the potato chip would have been submerged in the solution, meaning that the same surface area would be in contact with the solution.
If the potato chips could have been cut and measured by a precise machine my results could have been more accurate due to a more consistent surface area