Method for controlling variables
- Use a 100 ml measuring cylinder to measure 100 ml of each solution of salt
- Use a thermometer to monitor the room temperature to check that does not vary.
- Use the same potato tuber to cut all cylinders of potatoes tuber cells
- Use a core borer and ruler to cut cylinders of the same diameter with a length of 50.0mm
- Place the cylinders of potato tuber cells in the salt solutions at the same time and remove them all at the same time
- Use the same measuring cylinder and top –pan balance to measure the volume salt solutions and mass of the cylinders of potato tuber cells
Method for collecting data
- Collect 4 x 250 ml beakers. Use a 100 ml measuring cylinder to pour into them 100 ml of the four different salt solutions (0%, 5%, 10%, and 20%). Label each beaker in the rack using masking tape.
- Use a knife to remove the peel from a potato tuber. Using a core borer, cut 4 good cylinders from the potato cylinder (be careful no to muddle them up) and record it in table 1 below.
- Place each potato cylinder onto one of the 4 solutions. Leave them for as long as possible (at least 30 minutes, but all for the same time). While you are waiting read through the rest of the instructions.
- Take the cylinders out of the 4 solutions and dry them – be careful not to mix them up
Measure the new mass of each cylinder and record this on table 1.
Percentage in mass = New mass – Original mass x 100
Original mass
- Complete table 2 (overleaf) with your data and those of the groups. Your teacher will draw the table on the board for you to share your results.
- Calculate the mean percentage change in mass (dependent variable – y-axis): The y-axis will need to show positive and negative values.
Table 1 – Results of the investigation into the effect of osmosis on potato tissue
Table 2 – Class results of the investigation into the effort of osmosis on potato tissue
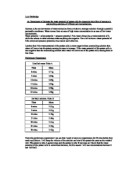
Conclusion:
In this lab we had to test osmosis using potatoes in different solutions of sucrose. To test osmosis we took potatoes with the same size and we weighted them before putting them in beakers with solutions with 0%, %5, 10% and 15% of sucrose.
After leaving the potatoes in the solution for half an hour we weighted the potatoes again and we got results showing that the percentage of change in the mass of the potatoes was bigger when the percentage of sucrose in the solution was lower.
Analysis:
My analysis in relation to the conclusion tells us that I this experiment we can see a clear example of osmosis. The results tells us that when there is a lower amount of sucrose in the solution the mass of the potato rises because sucrose needs water and the potato has more sucrose than the salt in the solution. And when there is a higher amount of sucrose in the water the potato mass decrease, this is because the sucrose in the water is greater than the sucrose in a potato causing the potato to lose mass due to its loss of water caused by the high amount of sucrose in the solution.
In this experiment we can determine that the percentage of sucrose in the potato is between 0 and 5 %.