Safety
We will be using scalpels to cut the potato down to our predefined length, this requires a cutting tile to protect out work surface and care in using a sharp implement.
Stools must be pushed in and the majority of the experiment will be done standing up.
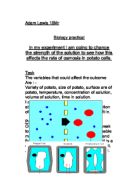
There must be at least five concentrations to test to produce sufficient evidence that proves or disproves my hypothesis. The concentrations available to be tested are:
- 0.25M
- 0.50M
- 1.0 M
- 1.5M
- 2.0M
- 2.5M
Equipment
- Beakers/boiling tube
- Test tube rack
- Scalpel and cutting tile
- Sucrose Solutions
- Balance
- Stopwatch
- Potato
- Paper towels
Preliminary Test Conclusions
We selected a core extract of diameter 1.5cm; this would be the set size for all our cylinders of potato. We trialed different lengths of our cylindrical pieces of potato, at first 1.0M solution.
However, there was no set time that we have recorded, so we trialed the next two lengths for different time stances, under 2M sucrose solution.
We decided that 10ml of each solution would be used each time which was enough for the potato to ‘sit’ in. The time was set for 10 minutes also to give time for osmosis to occur and equilibrium attained. The desired length we chose was 5cm in the end because the results varied with any length shorter; there is more room for error with smaller samples because of their size, ie. Cutting and weighing.
We also learnt care must be taken not to squeeze the potato when rolling off the excess sugar solution, the beakers shouldn’t be used because they did not cover the cylindrical shape of the potato efficiently enough, therefore boiling tubes were used. This also meant we could conduct more than one experiment at one time provided we had two stopwatches.
We also thought that it would be interesting to see how cooking the potato – thus killing the potato cells affected osmosis. My initial prediction is that the potato will have a lower water potential than the sugar solution, because cooking the potato kills the cell and water escapes. Once the potato is out of the water and rolled dry (so no excess water affects the weight) then it will have lower water content than when it was raw. Therefore by osmosis the water from the sugar solution will move into the potato, however the stronger the concentration of sucrose solution, the less water will move into the dead potato cells.
Results
Analysis
The results compiled are wholly unreliable because there is dramatic difference between the values. The one thing that does fit with my hypothesis in the cooked potato is that it took in more water than that of the raw potato, this indicated by the cooked potato having a steeper line on the average of averages experiment graph.
Usually anomalous results are incorrect, but the circle in yellow indicate the anomalous results from each graph of cooked and uncooked potato but, these do tally with my predictions with scientific theory in mind. The connection between osmosis should be the inverse of concentration, as osmosis decreases the concentration should increase, not osmosis increasing with concentration. The graph should also be a parabola not straight, because osmosis and concentration aren’t proportional there is no rate of anything, there is no formula that states for n concentration, there is y weight change. The first graph of initial results shows a curve for the cooked potato, which is the right kind of graph but does not match science!
If the results graphed were reflected in the negative y-axis they might be believable because osmosis should decrease as concentration increases. At first glance at my results table I wondered if I’d recorded the results for ‘after’ in the ‘before’ column but this is consistent throughout the whole table so I don’t think I’d make a huge mistake and keep making it.
Conclusion
Our results are inconclusive, and the findings cannot be held as reliable. If a graph is plotted from the two anomalous results it produces a graph more believable, however more points really are needed because a straight line through one point is not convincing evidence.
At first from the preliminary viewing of results I thought that perhaps 2M sucrose solution was too dilute to produce an effect, so that was why the results were slightly conflicting with my hypothesis. But, if this was true, then a pattern would emerge that as the concentration decreased, osmosis - the weight after the experiment should increase, there should be a pattern between 0.5M and 1.0M even if the potato gained weight instead of giving out water – lowering the weight then the pattern would still create a graph going down instead of up.
If the graph looked as though it was going down it would tie in with my hypothesis, and I could say that due to inaccuracy the results are slightly unreliable but the principal is there.
Our preliminary results appear more reliable, we assumed; because the results followed our prediction therefore it was all right to proceed by changing length and going ahead with the experiment. Something must have gone terribly wrong in the data collection.
Evaluation
I feel that the main cause for error in this experiment is lack of recordings, there is a gap for the 0.5M cooked potato this may have been because I did not take these down and the other person working with me did, or we had to terminate the experiment completely due to unforeseen circumstances, or we were cut short on time and had to stop.
It would have been quite useful to have a full set of results, even as scanty as they are, because the cooked potato in it’s entirety may have been enough to imply that my prediction was correct or not.
The lack of evidence is a definite problem; due to time limitations we never tested the whole amount of concentrations available. Too much time was taken in the preliminary testing and not enough in the real experiment. This was partly to do with our work pace, and availability of materials, there was only one bag of potatoes for the whole class, we used 5cm to produce the best results. In practice however this is not a practical size because the potatoes were of an ‘average’ size they were not baking potato size and only a limited amount of 5cm cylinders could be made from one potato. This gave rise to waste, the actual core extraction that contained the 5cm we wanted – but also excess this meant the potato was quickly spent and there were not no more potatoes left, slowing down our experiment.
Also the time variable was not a sensible one, if we cut the ten minutes by half we could have done more experiments and not waste time by waiting for osmosis – rather like watching paint drying!
Coming back to the cylindrical extractions, we went through the core of the potato, but then to obtain more we used different parts of the potato, the core would be the most saturated with water, therefore the weight of potato at the start of every experiment would vary greatly. Cylindrical potato is not an accurate measure. To gain a more accurate result we should have used smaller pieces of potato, perhaps in square units, for exampled 1cm3 giving rise to many samples. The fluctuation is likely to be less as the units are smaller and there would be a gradual change between the cubes. There would be less waste and more experiments could be done, especially if the experiment went down by 50%. Decrease, potato size must be accompanied with a decrease in time. Cubes are much smaller so they fit in test tubes and can be lined up in test tube racks so each concentration can be tried 3 times all at once. At least this way the potato is used as soon as it is cut and doesn’t have to sit and dry out more than the others.
I think we were getting more desperate towards the end of the time for experiments allowed and as 5cm length could not be changed (controlled variable) it would interfere with the fairness of the investigation. We had to use slightly less potato length or add off-cuts to make up the length obviously this altered surface area because two ends more than usual was exposed, but really this is miniscule. But I do realise that this is changing our controlled variable, therefore making those results void although I cannot verify which those were, but most likely those towards the end of the investigation as resources and time became scarcer.
Another problem was the skin left at both ends of the potato, this had to be cut away the texture of the potato is not like metal or clear cut, even a slant of the scalpel made the length inaccurate to start with. For optimum results then a machine or guillotine with parallel edges should have been used, not crudely cutting manually.
To improve my enquiry I could/should have:
- Carried out more tests for different concentrations
- Worked in a larger group so we didn’t all have to share a limited amount of potatoes
- Alternatively brought my own potatoes for my own use, that I select so they are all similar
- Pooled results from other groups, to get a wider range of results, either independently or as a whole class swap results
- Another way to try and make the potatoes as similar as possible was to use cloned potatoes
- A burette could have been used to accurately measure the amount of sucrose solution out
- The balance should not be tampered with, it was a while before someone fixed it after someone set it off making all measurements in that window of inaccuracy wrong
- If possible a balance that measured to a smaller magnitude ie. Not to 0.00 but to 0.0000g to maximise the degree of accuracy
- Measuring accurately in itself, it’s easy to distort the value on the balance by even standing near it or leaning on the table. Everybody crowded round waiting to use it moving about, and you hurry to stop people complaining that you take ages in waiting for the balance to settle. Again, if more time was allowed this wouldn’t happen, or it more balances were available stationed around the room.
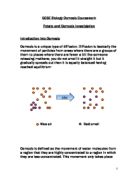
If the enquiry were to be repeated I don’t think I’d recommend a potato because it is too fiddly (an irregular shape) difficult to cut and there is too much room for error, but if it was possible with the sufficient time and more careful planning and accuracy, salt solution could be used instead of sugar to see if this produced the same results as sugar and verifying the hypothesis that osmosis will occur. If osmosis really does occur when one water gradient is less than another, the trend should be evident with any substance soluble in solution. We could even change the type of potato to see if all potatoes behave the same during osmosis, providing we conduct the experiment correctly.
Even better, a vegetable that is easy to cut such as a cucumber, something already cylindrical and repeat the investigation on that. (I do realise it isn’t a prism throughout, so some would be wasted but cutting round it could be easier. Cutting round an object could cut a set diameter.) A circle would maximise surface area and encourage osmosis and at least the slice would lay flat say in a petri dish and be completely submerged producing a more accurate result. I also know that cucumbers have high water content so any change should be more apparent.
Another theoretical way to observe osmosis is to stain celery, because it takes up dye through it’s xylem tubes and then see if this dye moves out into the solution, it probably isn’t practical but it is only an idea.
However you propose to discover osmosis in potatoes there is always room for human error and under classroom conditions and limitations in time, (which we needed more of) to complete our experiment to the standard of something substantial proving or disproving my hypothesis is very difficult.