Now to calculate the number of moles of products;
The number of moles is calculated from multiplying volume by density to calculate mass (which is provided on the enclosed sheet), and then dividing mass by molecular mass. This figure is then divided by 250 to calculate the number of moles in every 1cm3 sample.
Finally, since the equilibrium is shifting to the left during the reaction due to the low concentration of the reactants, the figure 1.45 x 10⁻³ is added to the reactants and subtracted from the products.
Molecular masses are such:
CH3COOH = 60
C2H5OH = 46
CH3COOC2H5 = 88
H2O = 18
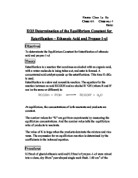
To find Kc, an expression is set up:
Kc = [CH3COOC2H5][H2O] / [CH3COOH][C2H5OH]
Where [X] represents the concentration of X.
Kc = [0.00167/V][0.02079/V] / [0.00145/V][0.00661/V]
The volumes all cancel;
Kc = 3.62
There are no units since they all cancel out with each other.
Comparing this with the approximate theoretical Kc, which is 4; we can calculate the error in the experiment.
Percentage error is calculated by:
100 x (Theoretical Value – Actual Value)
Theoretical Value
Percentage error = 100 x (4 – 3.62) / 4 = 9.5%
This value of Kc clearly shows that the equilibrium set up in the experiment produces accurate results since the calculated value is only deviated by 0.38 which is a 9.5% error margin; as shown above.
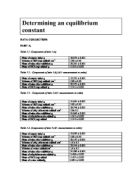
Conducting experiments 1, 2 and 3 as detailed on the enclosed sheet, provided such comparative values for Kc:
Calculating the percentage error for all of these results gives:
-9.5% < Theoretical Value < 27.5%
This clearly shows some varying results, all of which are distributed around the theoretical value of the equilibrium. However the deviations of these results when considering the size of the results involved is rather large.
This may be due to a range of reasons concerning the reliability of the experiment.
The concentration of the alkali used was 0.2M, this may be considered low but because accuracy is of utmost concern, a larger sample of more dilute alkali would yield a larger more accurate titre of the number of moles present in the solution. This is despite the fact that the titres taken were within 0.5cm3 of each other. Also if a 2cm3 sample were taken instead of simply 1cm3 then there would twice the number of moles of acid present and the titre would be sufficiently large to be considered accurate.
The indicator chosen was phenolphthalein, which has a transition pH of 8 – 9.6. This is above the optimal range for an acid-base reaction where such small concentrations are involved. Despite the fact that it is a weak acid – strong base reaction the end point of the reaction is does not increase infinitely when it reaches its turning point. This means that If the end point of the reaction were properly indicated, the exact volume required to neutralise the solution would be indicated. Bromothymol blue has a transition pH of 6 – 7.6 this would prove more satisfactory.
Ethanoic acid is a weak acid and therefore dissociates partially. The equilibrium is far to the left, showing that the is a huge amount more of the undissociated acid than there is dissociated acid. Dissociated acid does not react to form ethyl ethanoate in the reaction but since the abundance of it is small it is considered to be zero. This therefore means that the concentrations of the products of this reaction are assumed to be higher than they actually are.
This partly explains why there are results which are distributed higher than that of the theoretical value.
However the value of Kc for experiment 1, is somewhat larger than expected, that is a large amount of products were present in relation to the reactants also present.
This is a titration experiment based primarily around measuring the concentration of ethanoic acid present. This shows that upon titration, a smaller amount of alkali neutralised the solution than was expected and therefore a smaller amount of acid was present, after subtracting the acid catalyst.
The theoretical value of the equilibrium constant is calculated from standard conditions and therefore cannot be wholly compared with the value obtained from the room temperature and air pressure present in the laboratory.
The shift in temperature could have provided a shift in the equilibrium constant according to Le Chatelier’s principle of equilibrium dynamics. The temperature was most likely less than that of standard conditions (298K) therefore this gave a shift in the exothermic direction – to more products. However this source of error is questionable because all experiments were conducted in the same laboratory in the same interval in time.
Titration is a method which releases a precise quantity of fluid into a reactant containing vessel. This is done by viewing the bottom of the meniscus and controlling the flow of fluid out of the burette. This technique is flawed only by the measurement of the level of the meniscus and the fact that the device works on a large bore of tubing which allows for more variation with approximately the same result.
However the method of using a volumetric pipette with a 1cm3 measuring cylinder provides a hugely accurate volume of solution to which is mixed a large quantity of water which ensures all solution has been absorbed in.
To increase reliability of the overall method, a larger sample of the solution would have to be taken to ensure an accurate titre was achieved. An indicator which worked exactly within the pH range of the given experiment was chosen. The dissociation of the measured acid would have to be taken into account in order to provide an accurate concentration and there Kc value. A more accurate burette would have to be used which had smaller graduations and a smaller bore of tubing to reduce the size of the meniscus, and the experiment would have to be conducted under standard conditions.